Statistics
Overview
The Statistics page displays energy consumption data and device error reports directly within the application. Charts and tables update based on the selected date range and can be filtered by individual controls or groups.
Date Range and View
Use the controls at the top of the page to configure what data is shown:
| Control | Description |
|---|---|
| View by | The time granularity of the chart — e.g. Days, Weeks, Months. |
| From / To | The date range for which data is displayed. |
Controls / Groups Toggle
The toggle at the bottom of the page switches the statistics view between:
- Controls — data shown per individual device and port.
- Groups — data aggregated per control group.
Control Filter
Click the Control filter button in the top-right corner to filter the chart and tables to specific devices or groups, rather than showing the entire network at once.
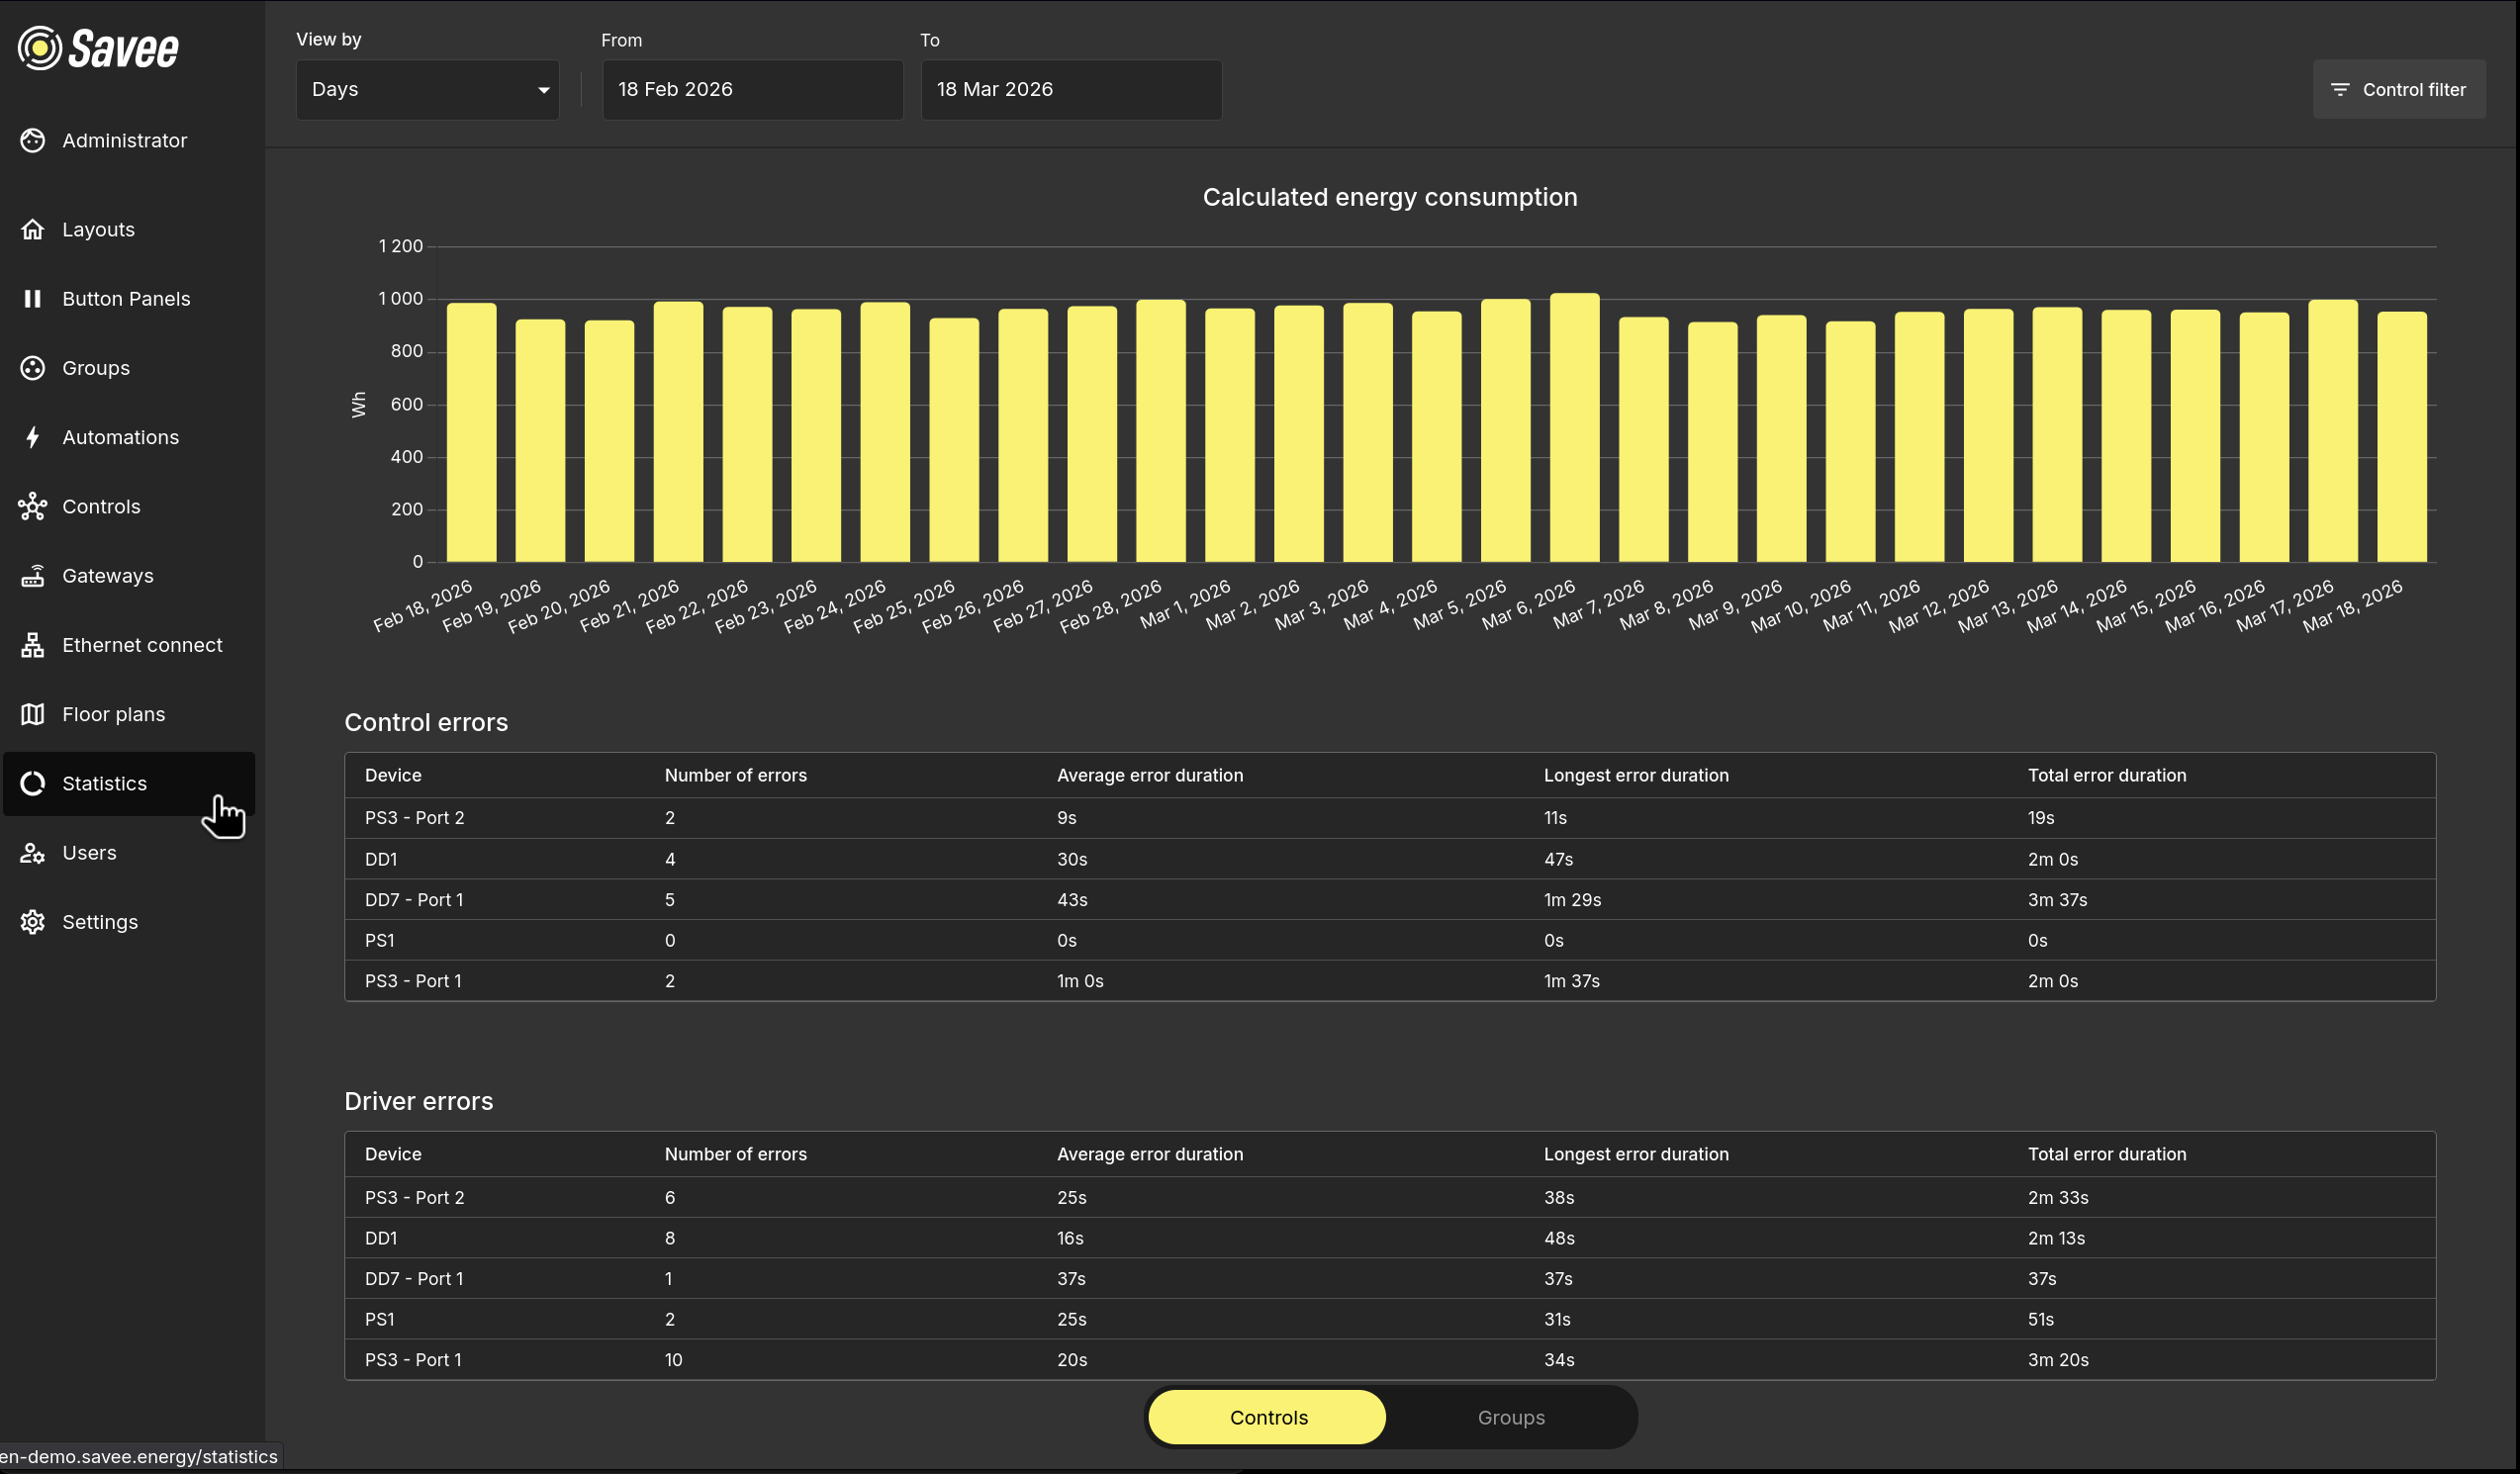
Calculated Energy Consumption
The bar chart shows the total calculated energy consumption over the selected date range, broken down by the chosen view granularity. Each bar represents one time period (e.g. one day when viewing by Days).
Error Reports
Below the energy chart, two error tables provide insight into communication reliability across the network.
Control Errors
Reports failures in sending control commands to devices.
Driver Errors
Reports failures at the device driver level, indicating hardware or firmware communication issues.
Both tables share the same columns:
| Column | Description |
|---|---|
| Device | The device or port where errors occurred. |
| Number of errors | Total count of errors in the selected period. |
| Average error duration | The mean duration of a single error. |
| Longest error duration | The duration of the longest single error. |
| Total error duration | The combined duration of all errors for this device. |