Settings
Overview
The Settings page is split into personal user settings and system-wide configuration. It is organized into subsections, accessible from the settings navigation panel on the left.
The following subsections are available: User settings, System settings, Privacy, Modbus, Statistics, Communication Channels, Reports, Two-Factor Authentication, Log, and Cloud.
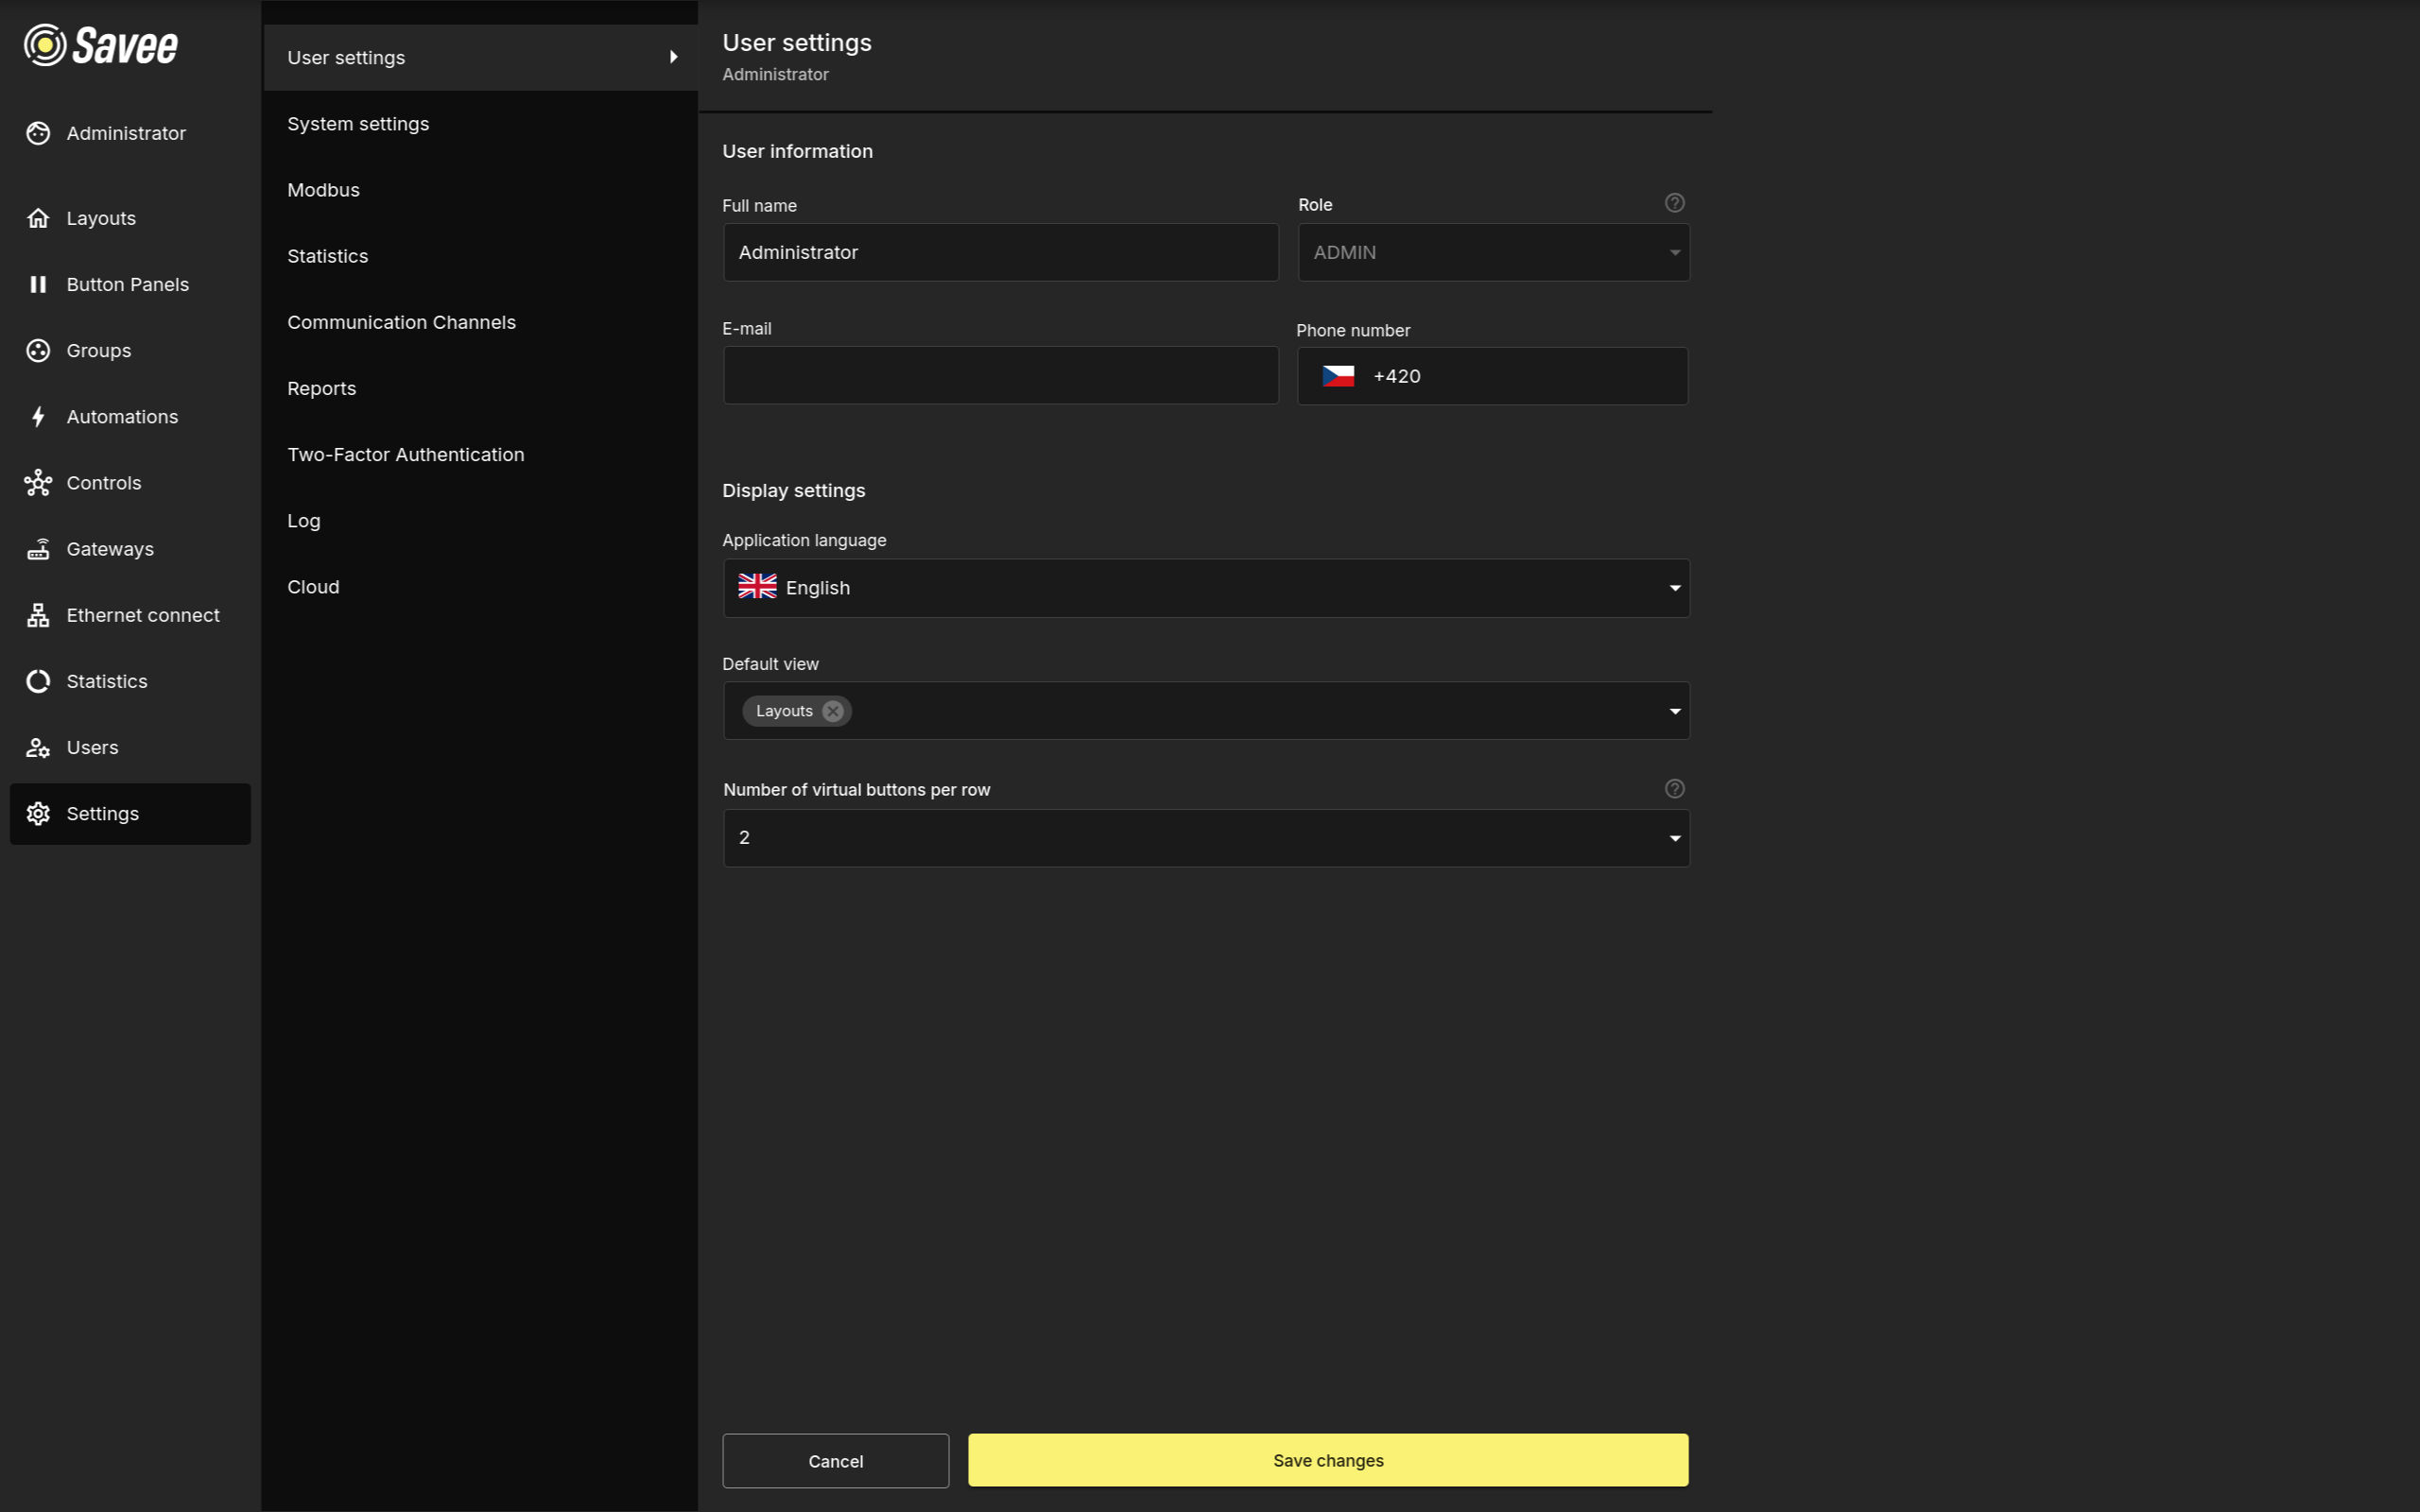
User Settings
The User settings section controls preferences for the currently signed-in account. These settings affect only the current user.
| Setting | Description |
|---|---|
| Full name | The display name shown for the user account. |
| Role | The user's assigned role. This field is shown for reference and cannot be changed here. |
| The email address used for notifications and reports. | |
| Phone number | The phone number used for notifications and reports. |
| Application language | The display language for the current user's application interface. |
| Default view | The page, floor plan, or button panel that opens immediately after the user signs in. |
| Number of virtual buttons per row | Controls how many virtual buttons are shown in each row in mobile view on Button Panels for this user. |
Note
Administrators can configure these settings for other users from the Users page.
System Settings
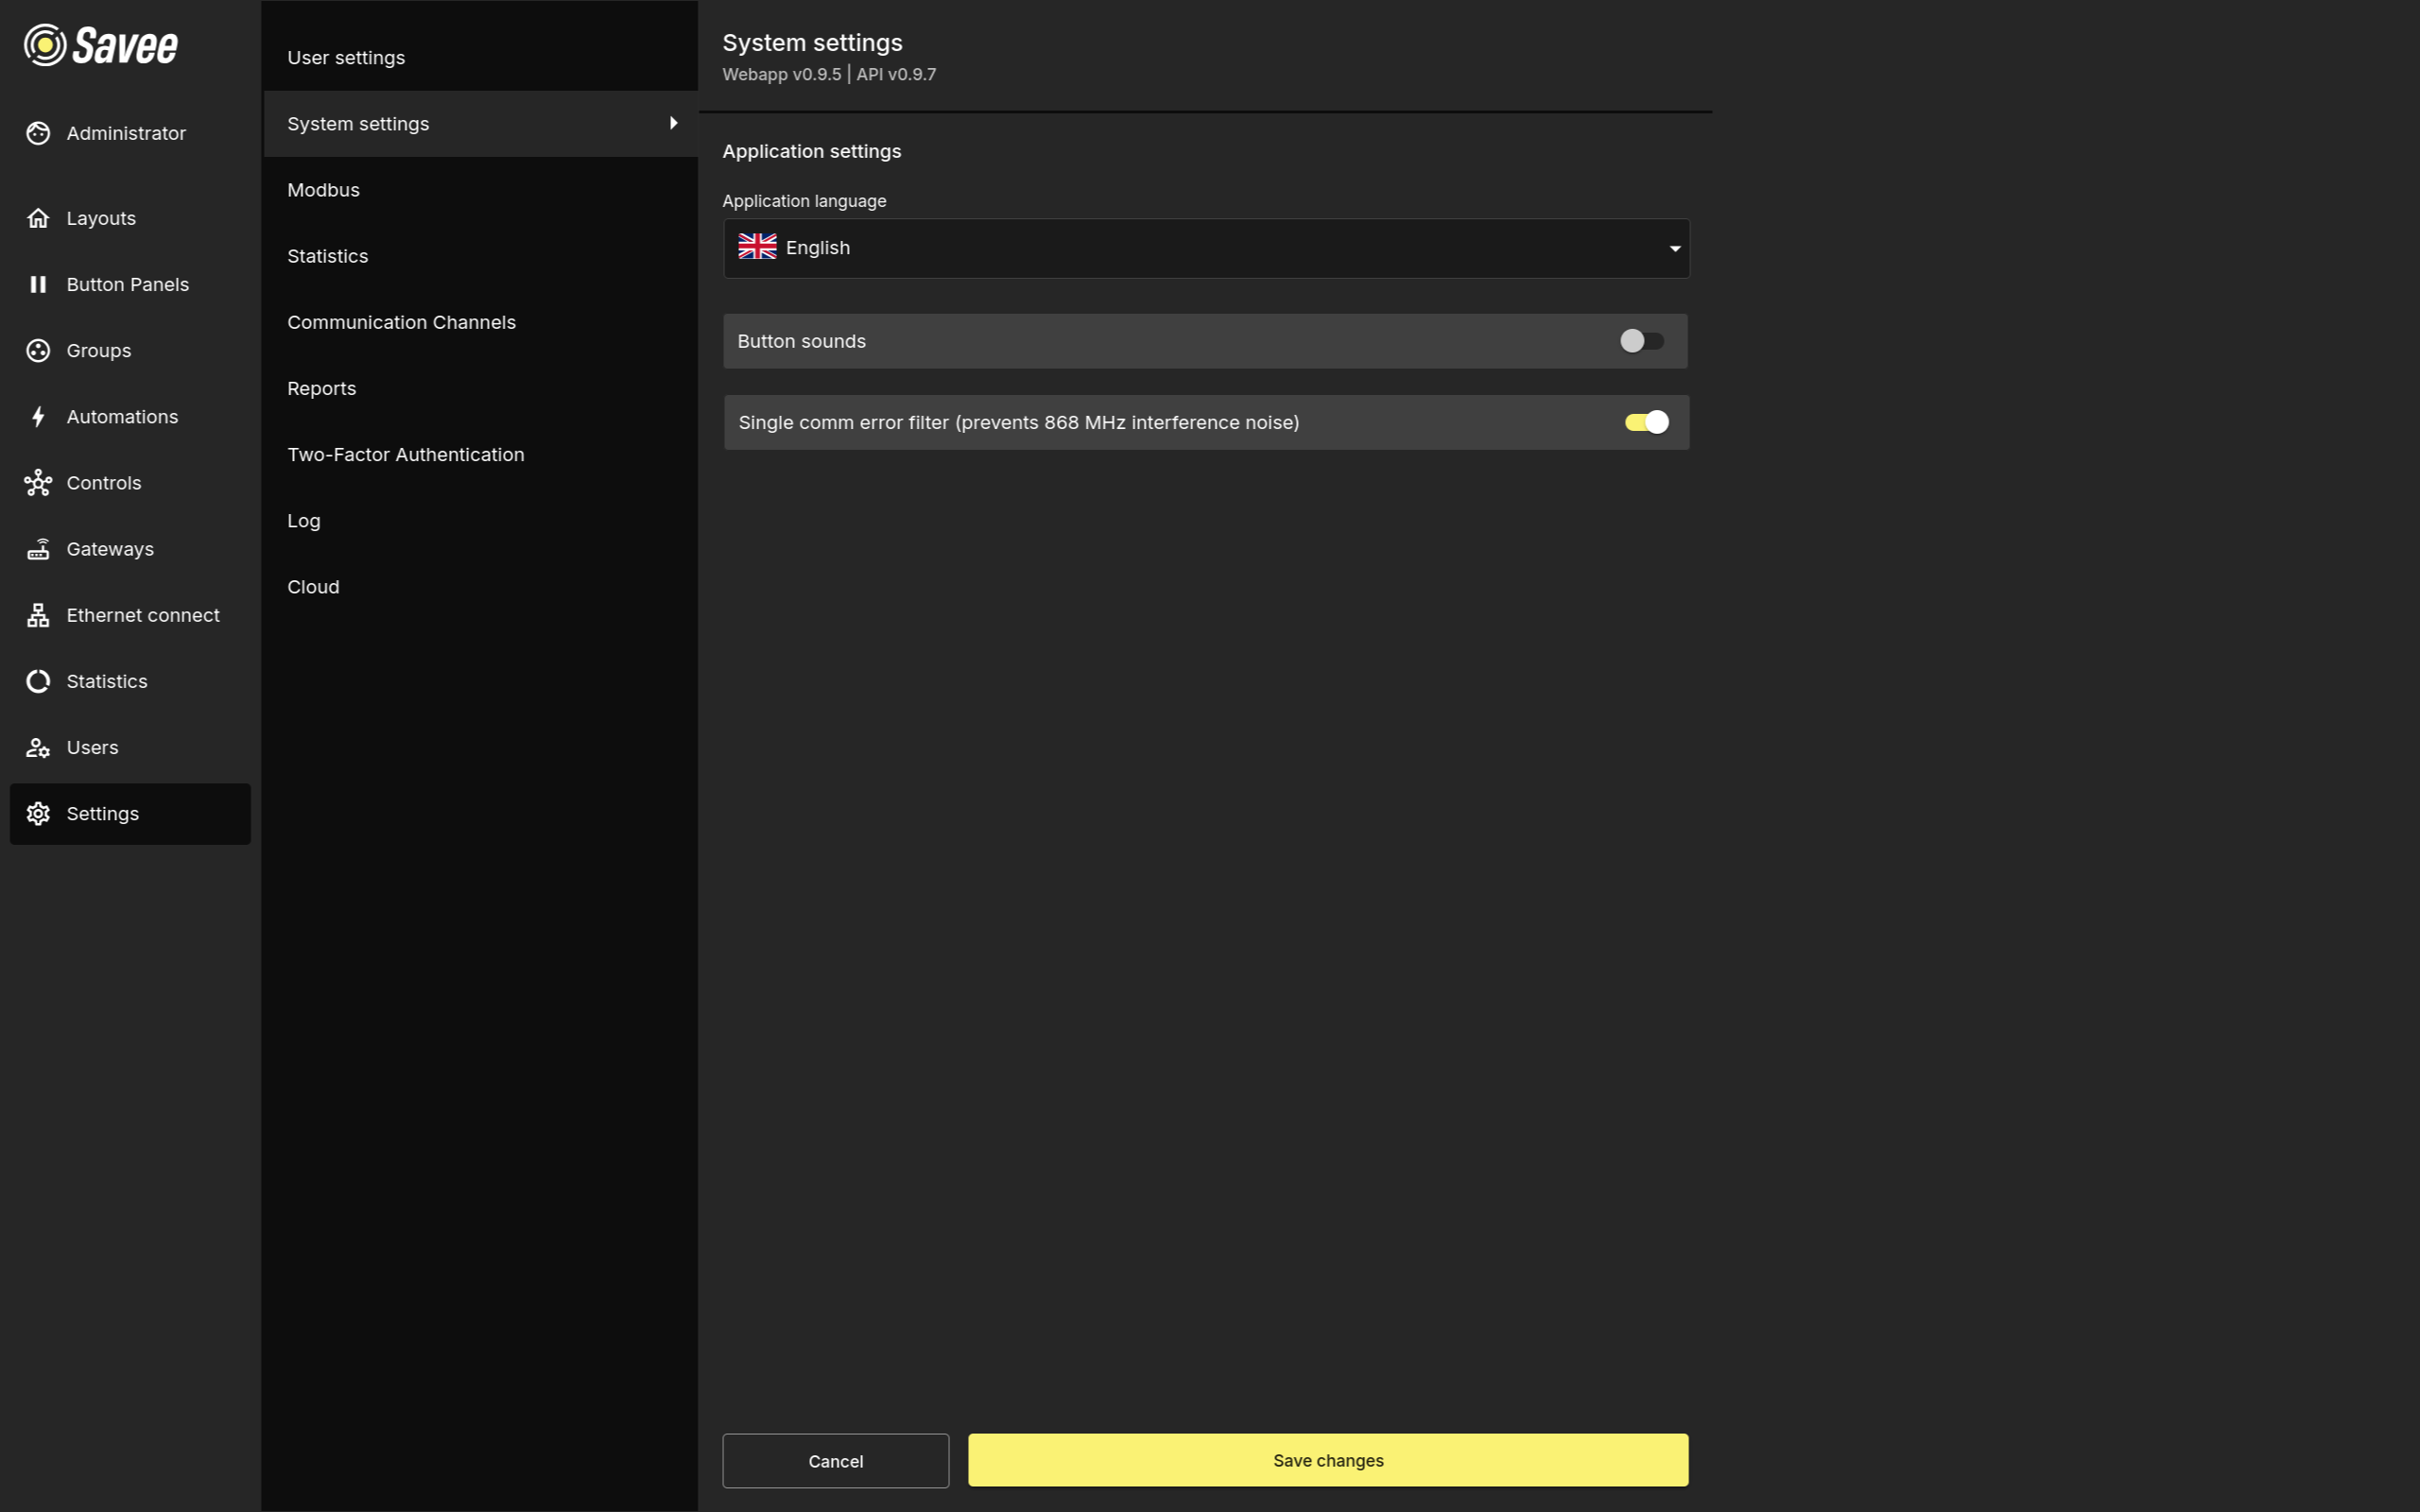
The top of the System settings page shows the currently installed versions of the Savee Webapp and Savee API. Changes in this section apply to the whole application.
| Setting | Description |
|---|---|
| Application language | The default display language for the application. |
| Button sounds | When enabled, button panels play a sound on press. |
| Single comm error filter | Filters isolated 868 MHz communication errors to reduce interference noise in the application. |
Modbus
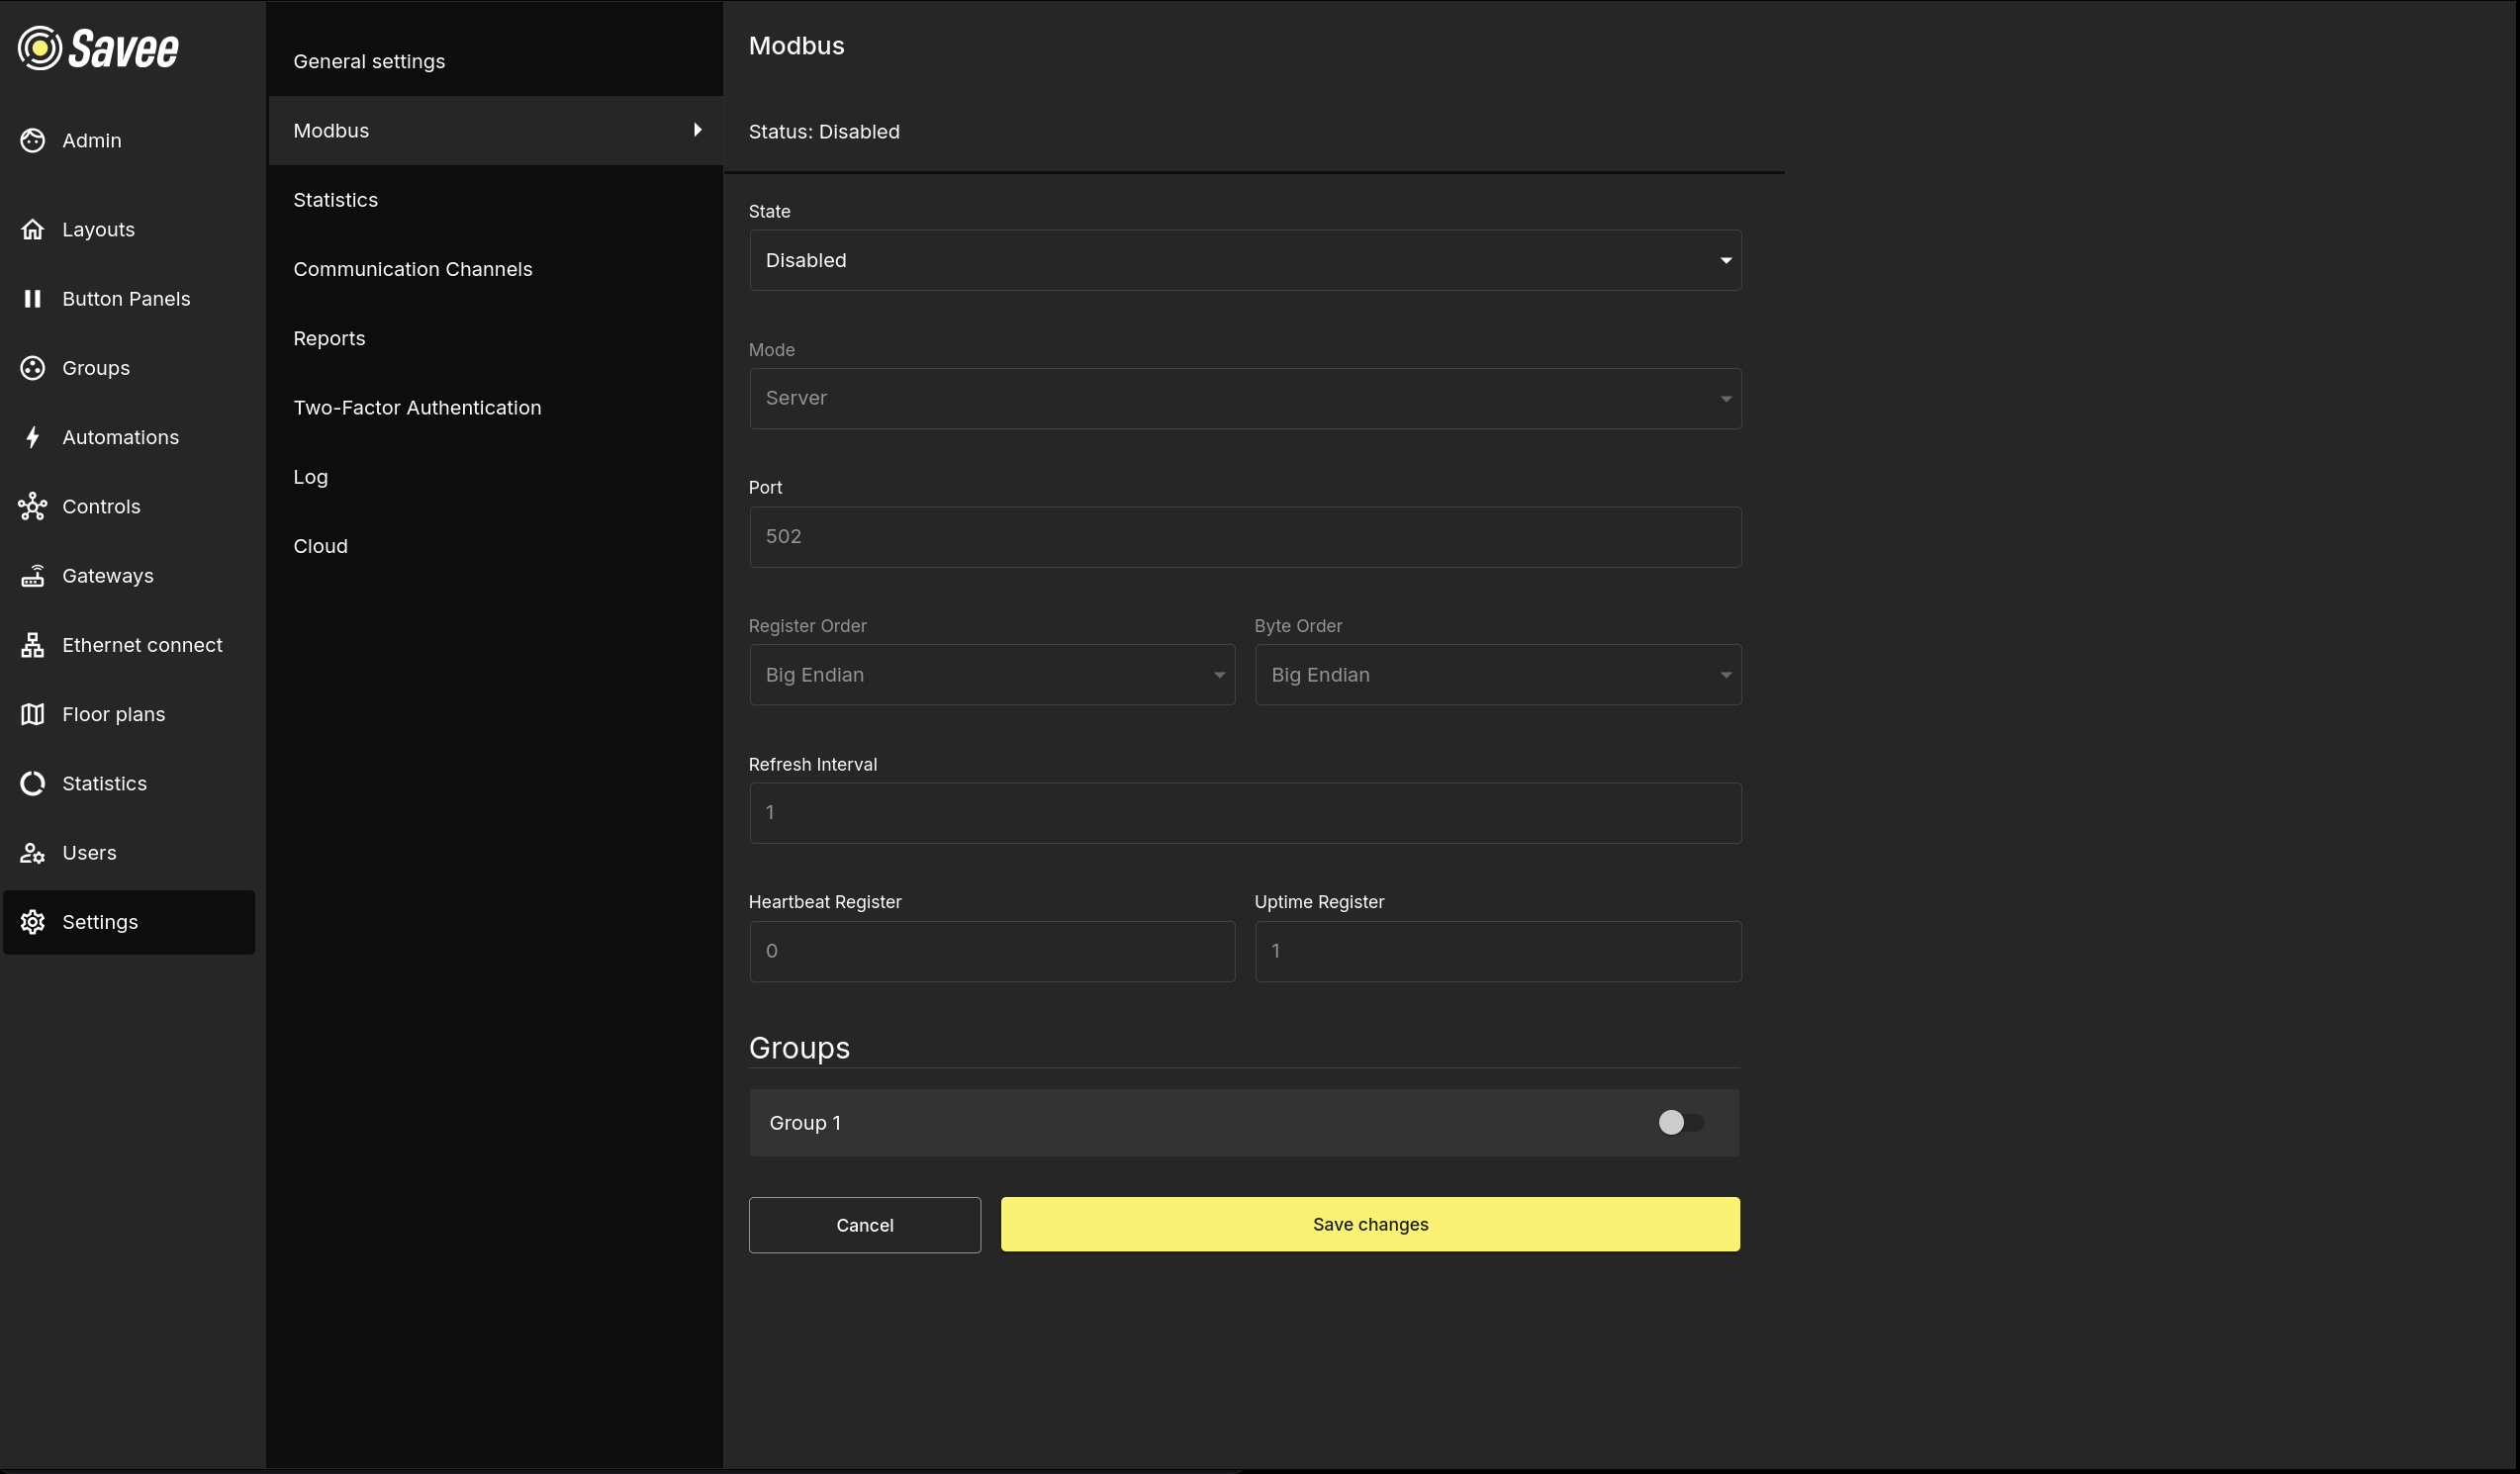
Configures the Modbus integration for the Savee application. For full implementation details, refer to the APIs → Modbus.
| Field | Description |
|---|---|
| State | Read-only display of the current Modbus service status: Enabled, Enabling, Disabled, Disabling, Restarting, or Error. |
| Mode | Server — Savee acts as a Modbus server for connected clients. Client — Savee connects to an external Modbus server. |
| Port | In Server mode: the port Savee listens on. In Client mode: the URL (ip:port) of the external Modbus server. |
| Register Order | The byte order for multi-register values (Big Endian or Little Endian). Applies to UPTIME and POWER, which span two registers. |
| Byte Order | The byte order within each individual 2-byte register (Big Endian or Little Endian). |
| Refresh Interval | In Server mode: how often the HEARTBEAT register is updated. In Client mode: how often Savee polls the Modbus server. |
| Heartbeat Register | The register index used for the HEARTBEAT value. |
| Uptime Register | The register index used for the UPTIME value. |
Warning
UPTIME occupies two consecutive registers because it stores a 32-bit number. Leave the address immediately after the UPTIME index empty.
Groups — Lists all groups in the application. Toggle each group to expose it over Modbus. When enabled, an Address field appears where the starting register address for that group must be set. Each group occupies 16 consecutive holding registers, so addresses must be spaced 16 apart (e.g. Group 1 at 3, Group 2 at 19, Group 3 at 35).
Warning
Do not assign the Heartbeat or Uptime register addresses to any group.
Info
Savee indexes Modbus holding registers starting from 0.
Statistics
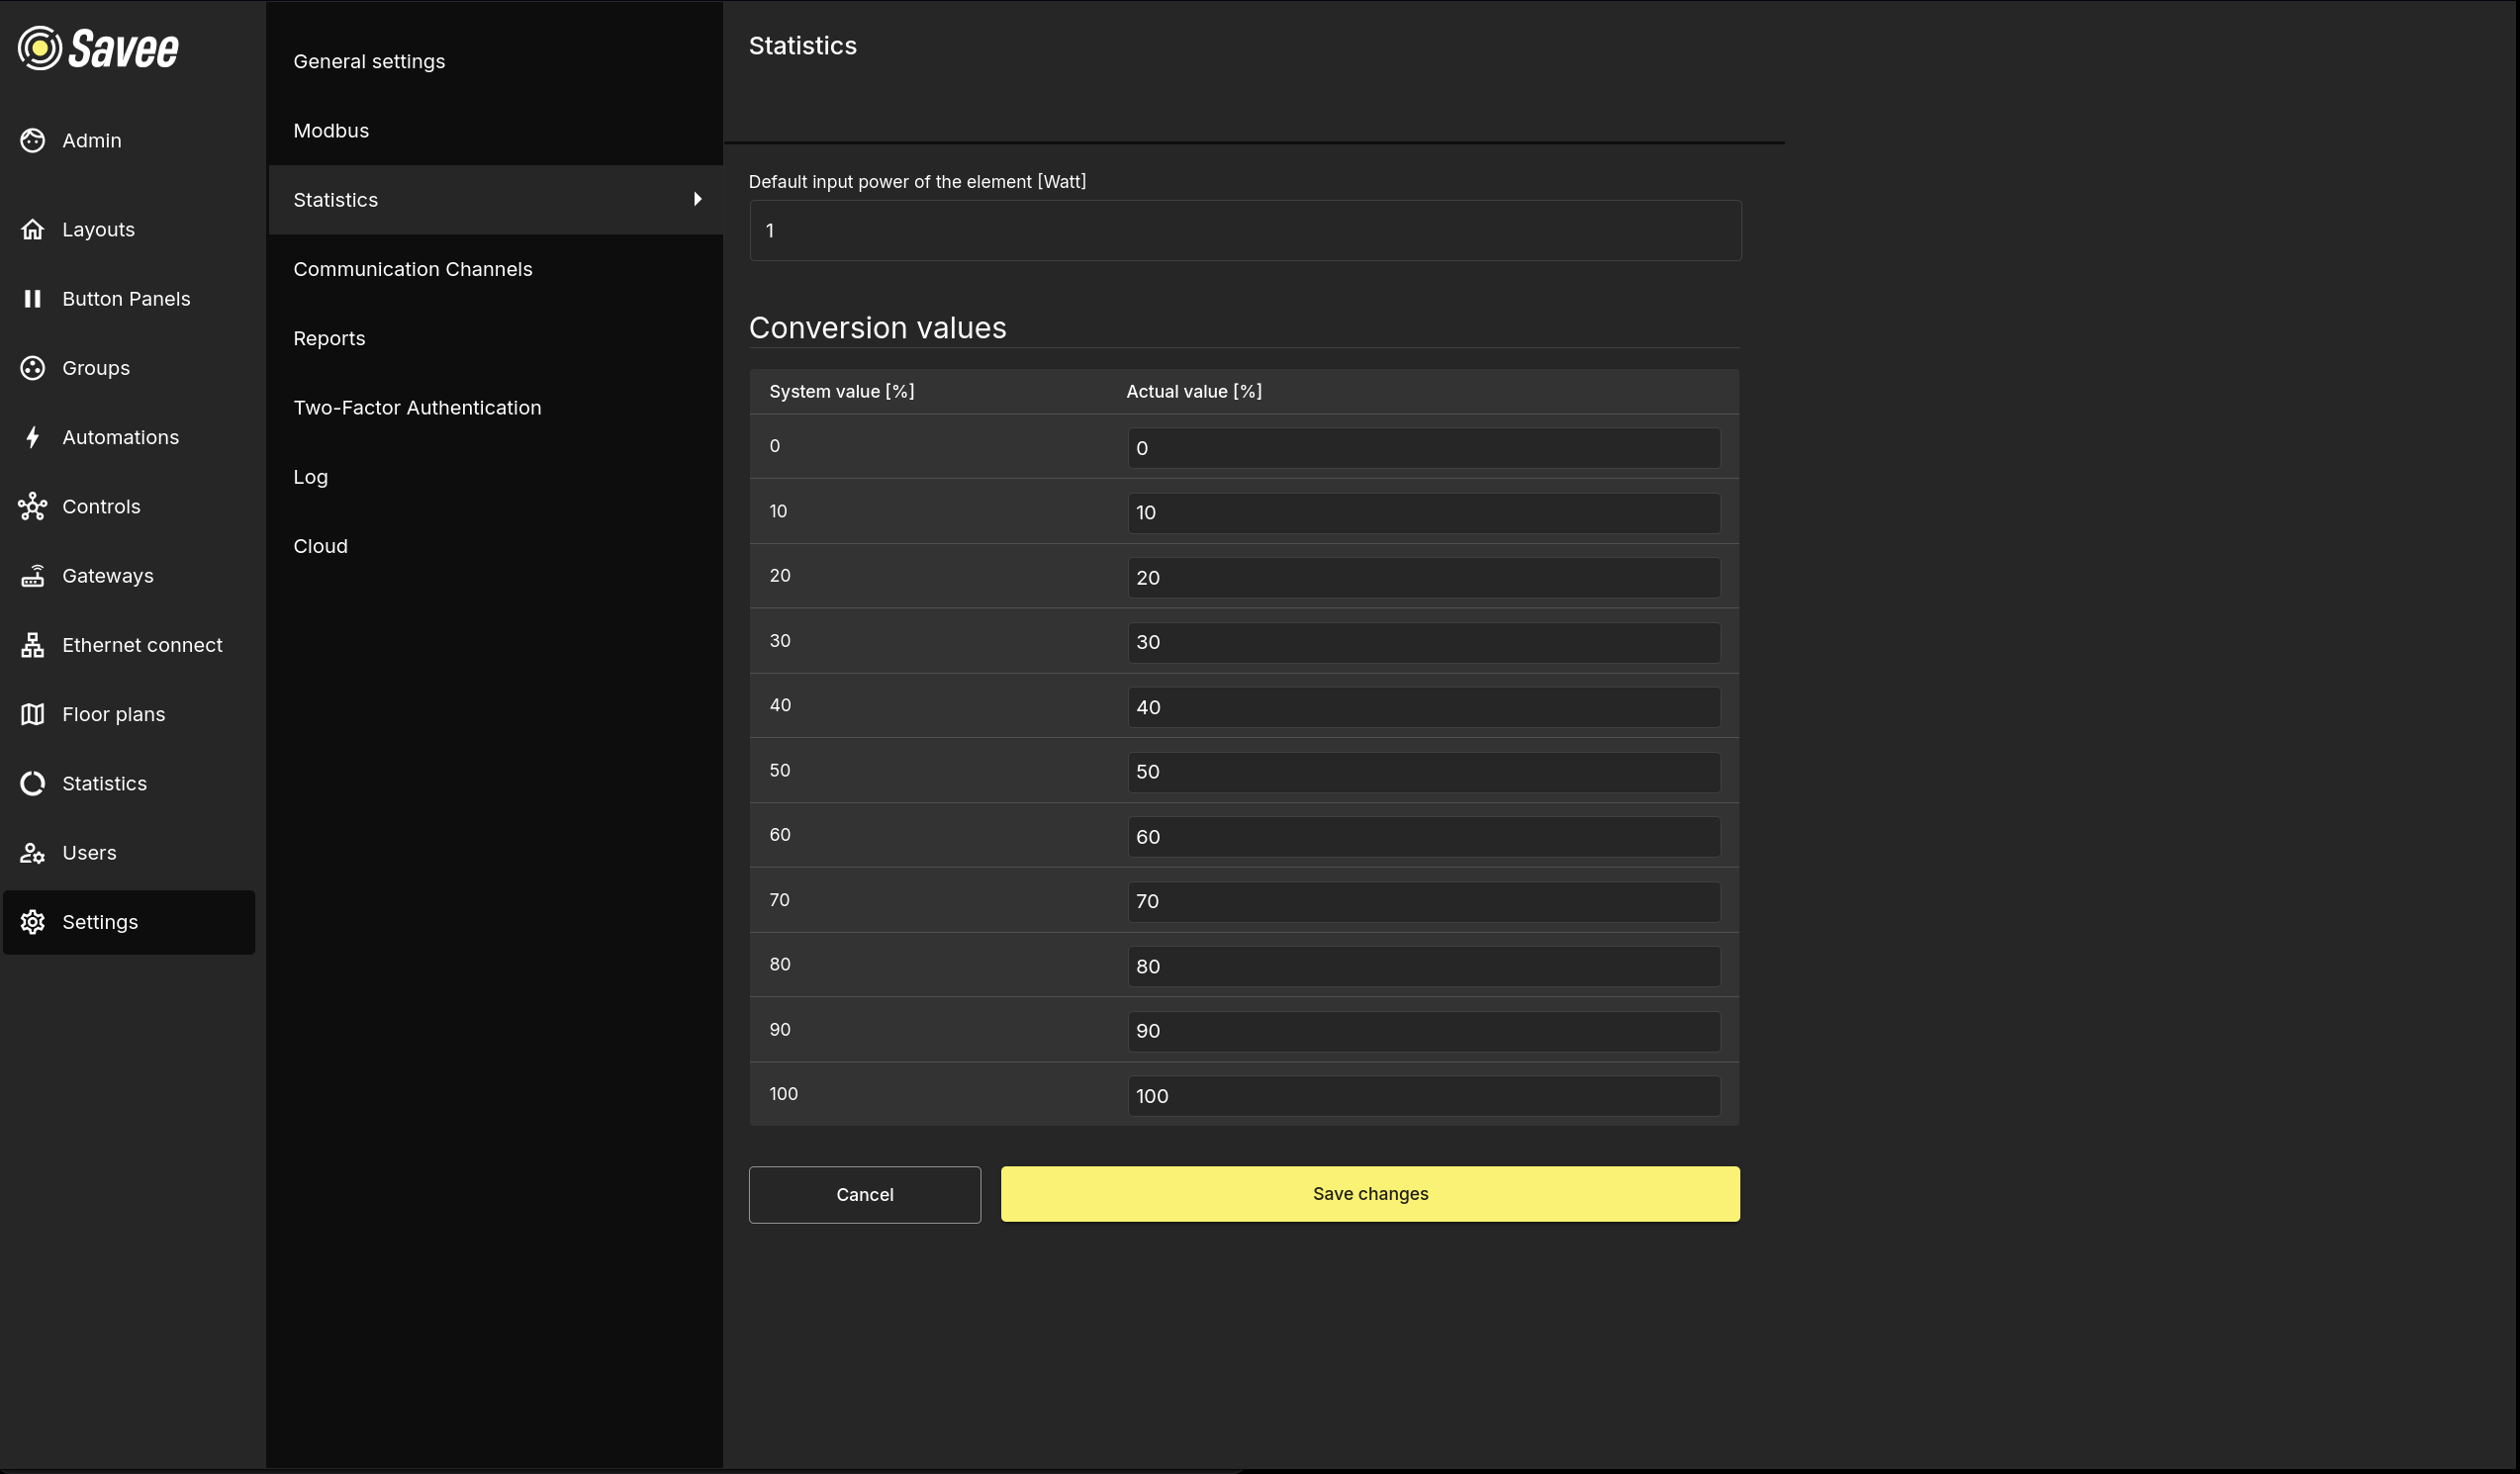
Configures how energy consumption is calculated in the Statistics page.
| Field | Description |
|---|---|
| Default input power of the element [Watt] | The assumed wattage used for energy calculations when a device has no specific power value configured. |
| Conversion values | A table mapping system output levels (0–100% in steps of 10) to actual power output percentages. Edit the Actual value column to calibrate calculations to match the real-world dimming curve of the installed equipment. |
Communication Channels
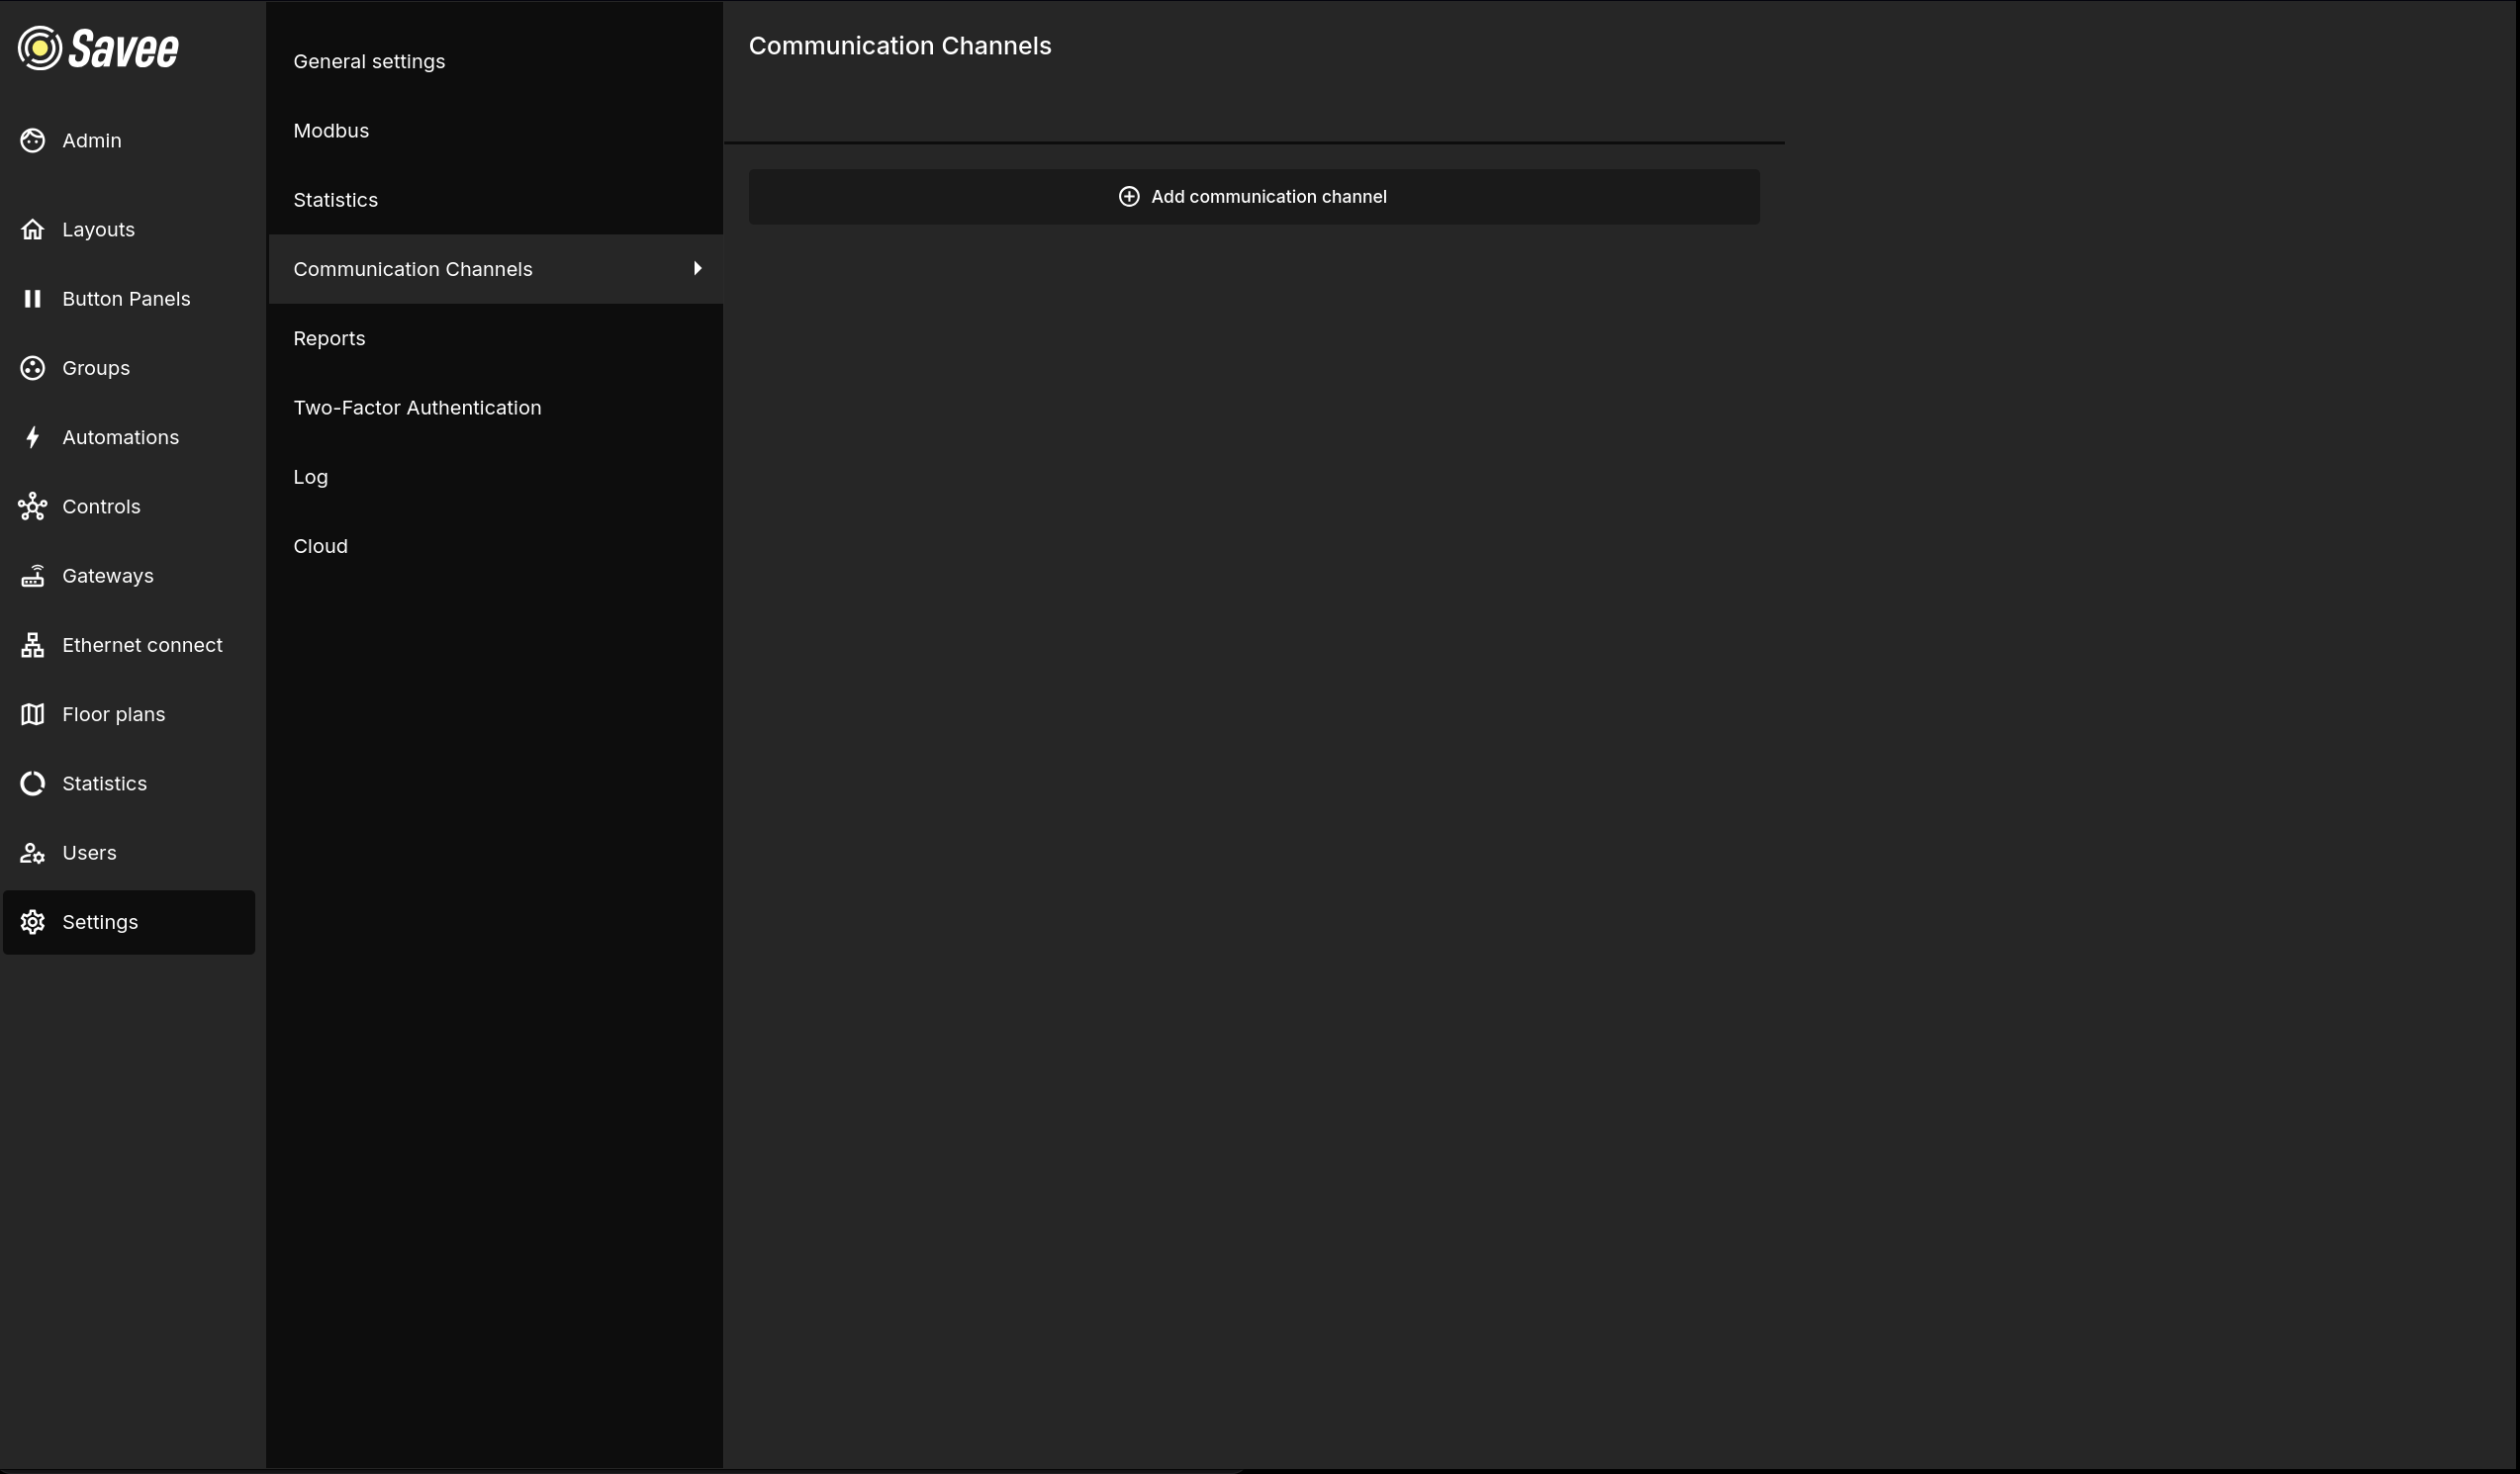
Communication channels define the delivery methods used by the Reports system to send notifications to users. Click + Add communication channel to create a new channel.
| Field | Description |
|---|---|
| Name | A label to identify the channel. |
| Description | An optional description. |
| Type | The delivery method (e.g. email, SMS). |
| Enabled | Whether the channel is active and available for use in reports. |
Note
Users must have a phone number or email address set in their user profile for the reporting system to reach them through the corresponding channel type.
Reports
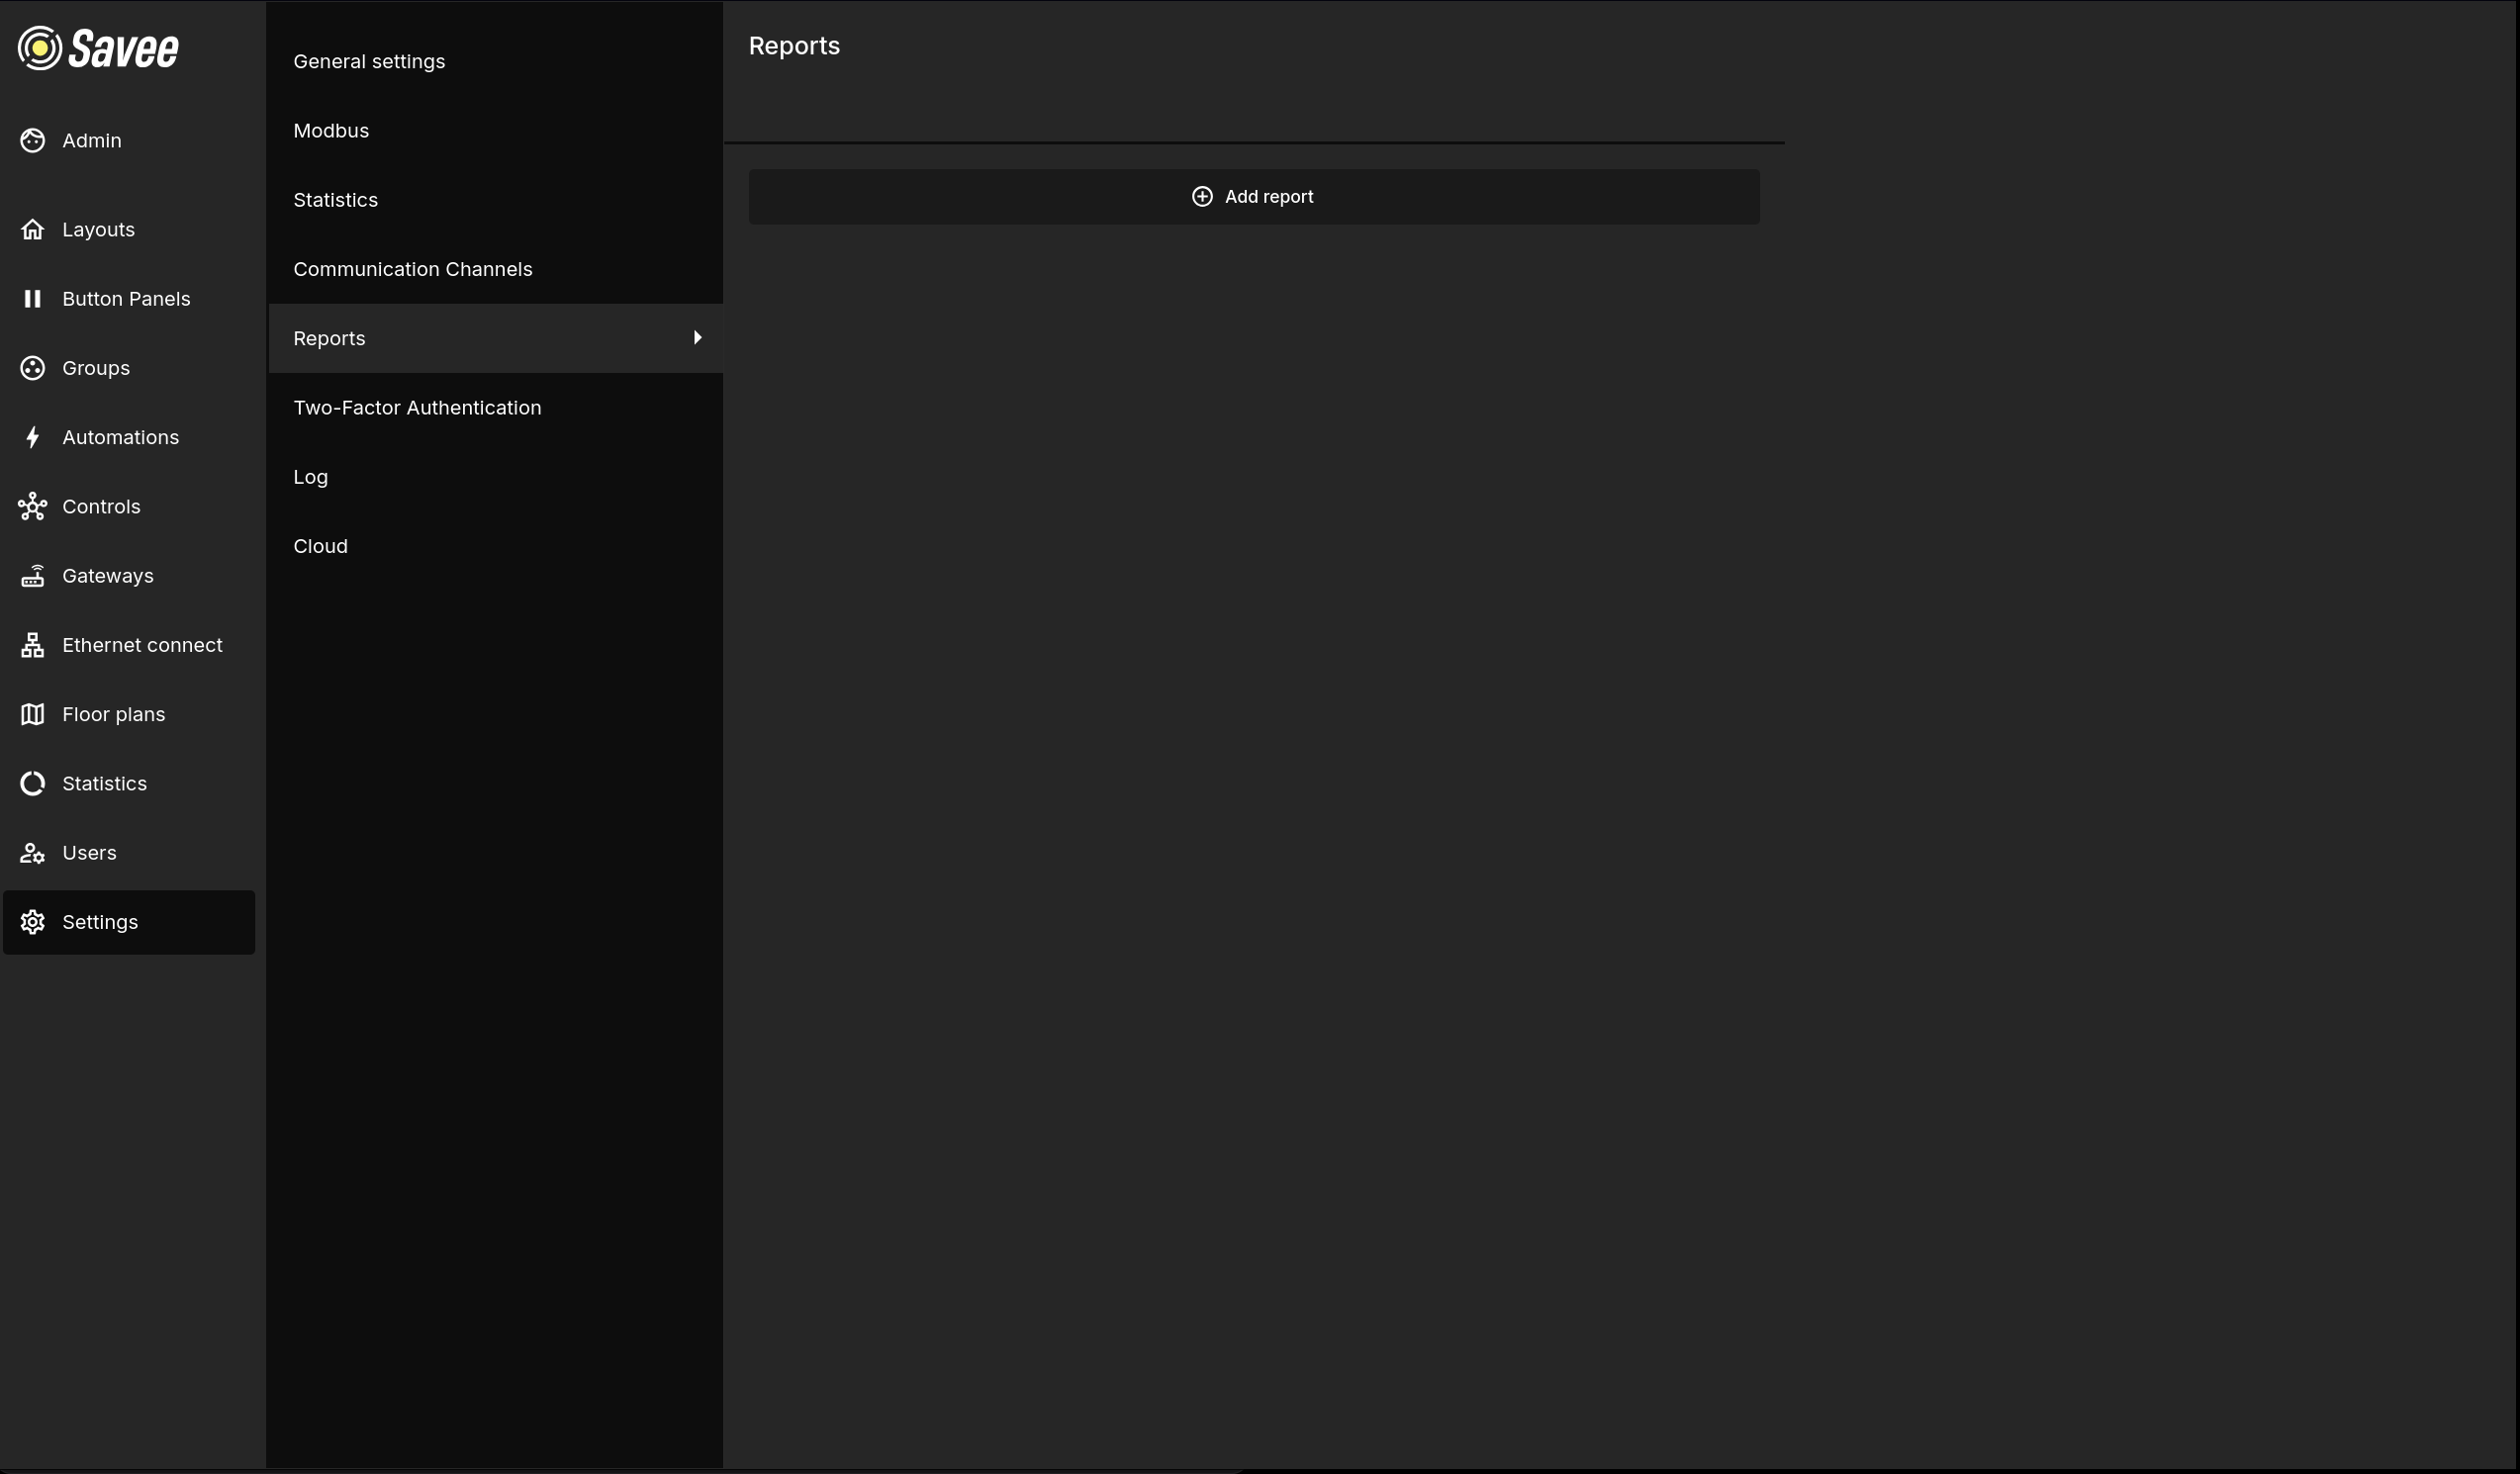
Reports define automated notifications sent to users via communication channels. Click + Add report to create a new report. Two report types are available:
Instant Message
Sends a notification immediately when a specified event occurs.
| Field | Description |
|---|---|
| Name | A label to identify the report. |
| Description | An optional description. |
| Type | Set to Instant message. |
| Event | The event that triggers the notification (e.g. All). |
| Users | The users who will receive the notification. |
| Communication channels | The channel(s) through which the notification is sent. |
| Enabled | Whether the report is active. |
Scheduled Report
Sends a summary report on a recurring schedule.
| Field | Description |
|---|---|
| Name | A label to identify the report. |
| Description | An optional description. |
| Type | Set to Scheduled report. |
| Period | How often the report is sent (e.g. Monthly). |
| Template | The report template to use (e.g. Comprehensive summary). |
| Users | The users who will receive the report. |
| Communication channels | The channel(s) through which the report is sent. |
| Enabled | Whether the report is active. |
Two-Factor Authentication
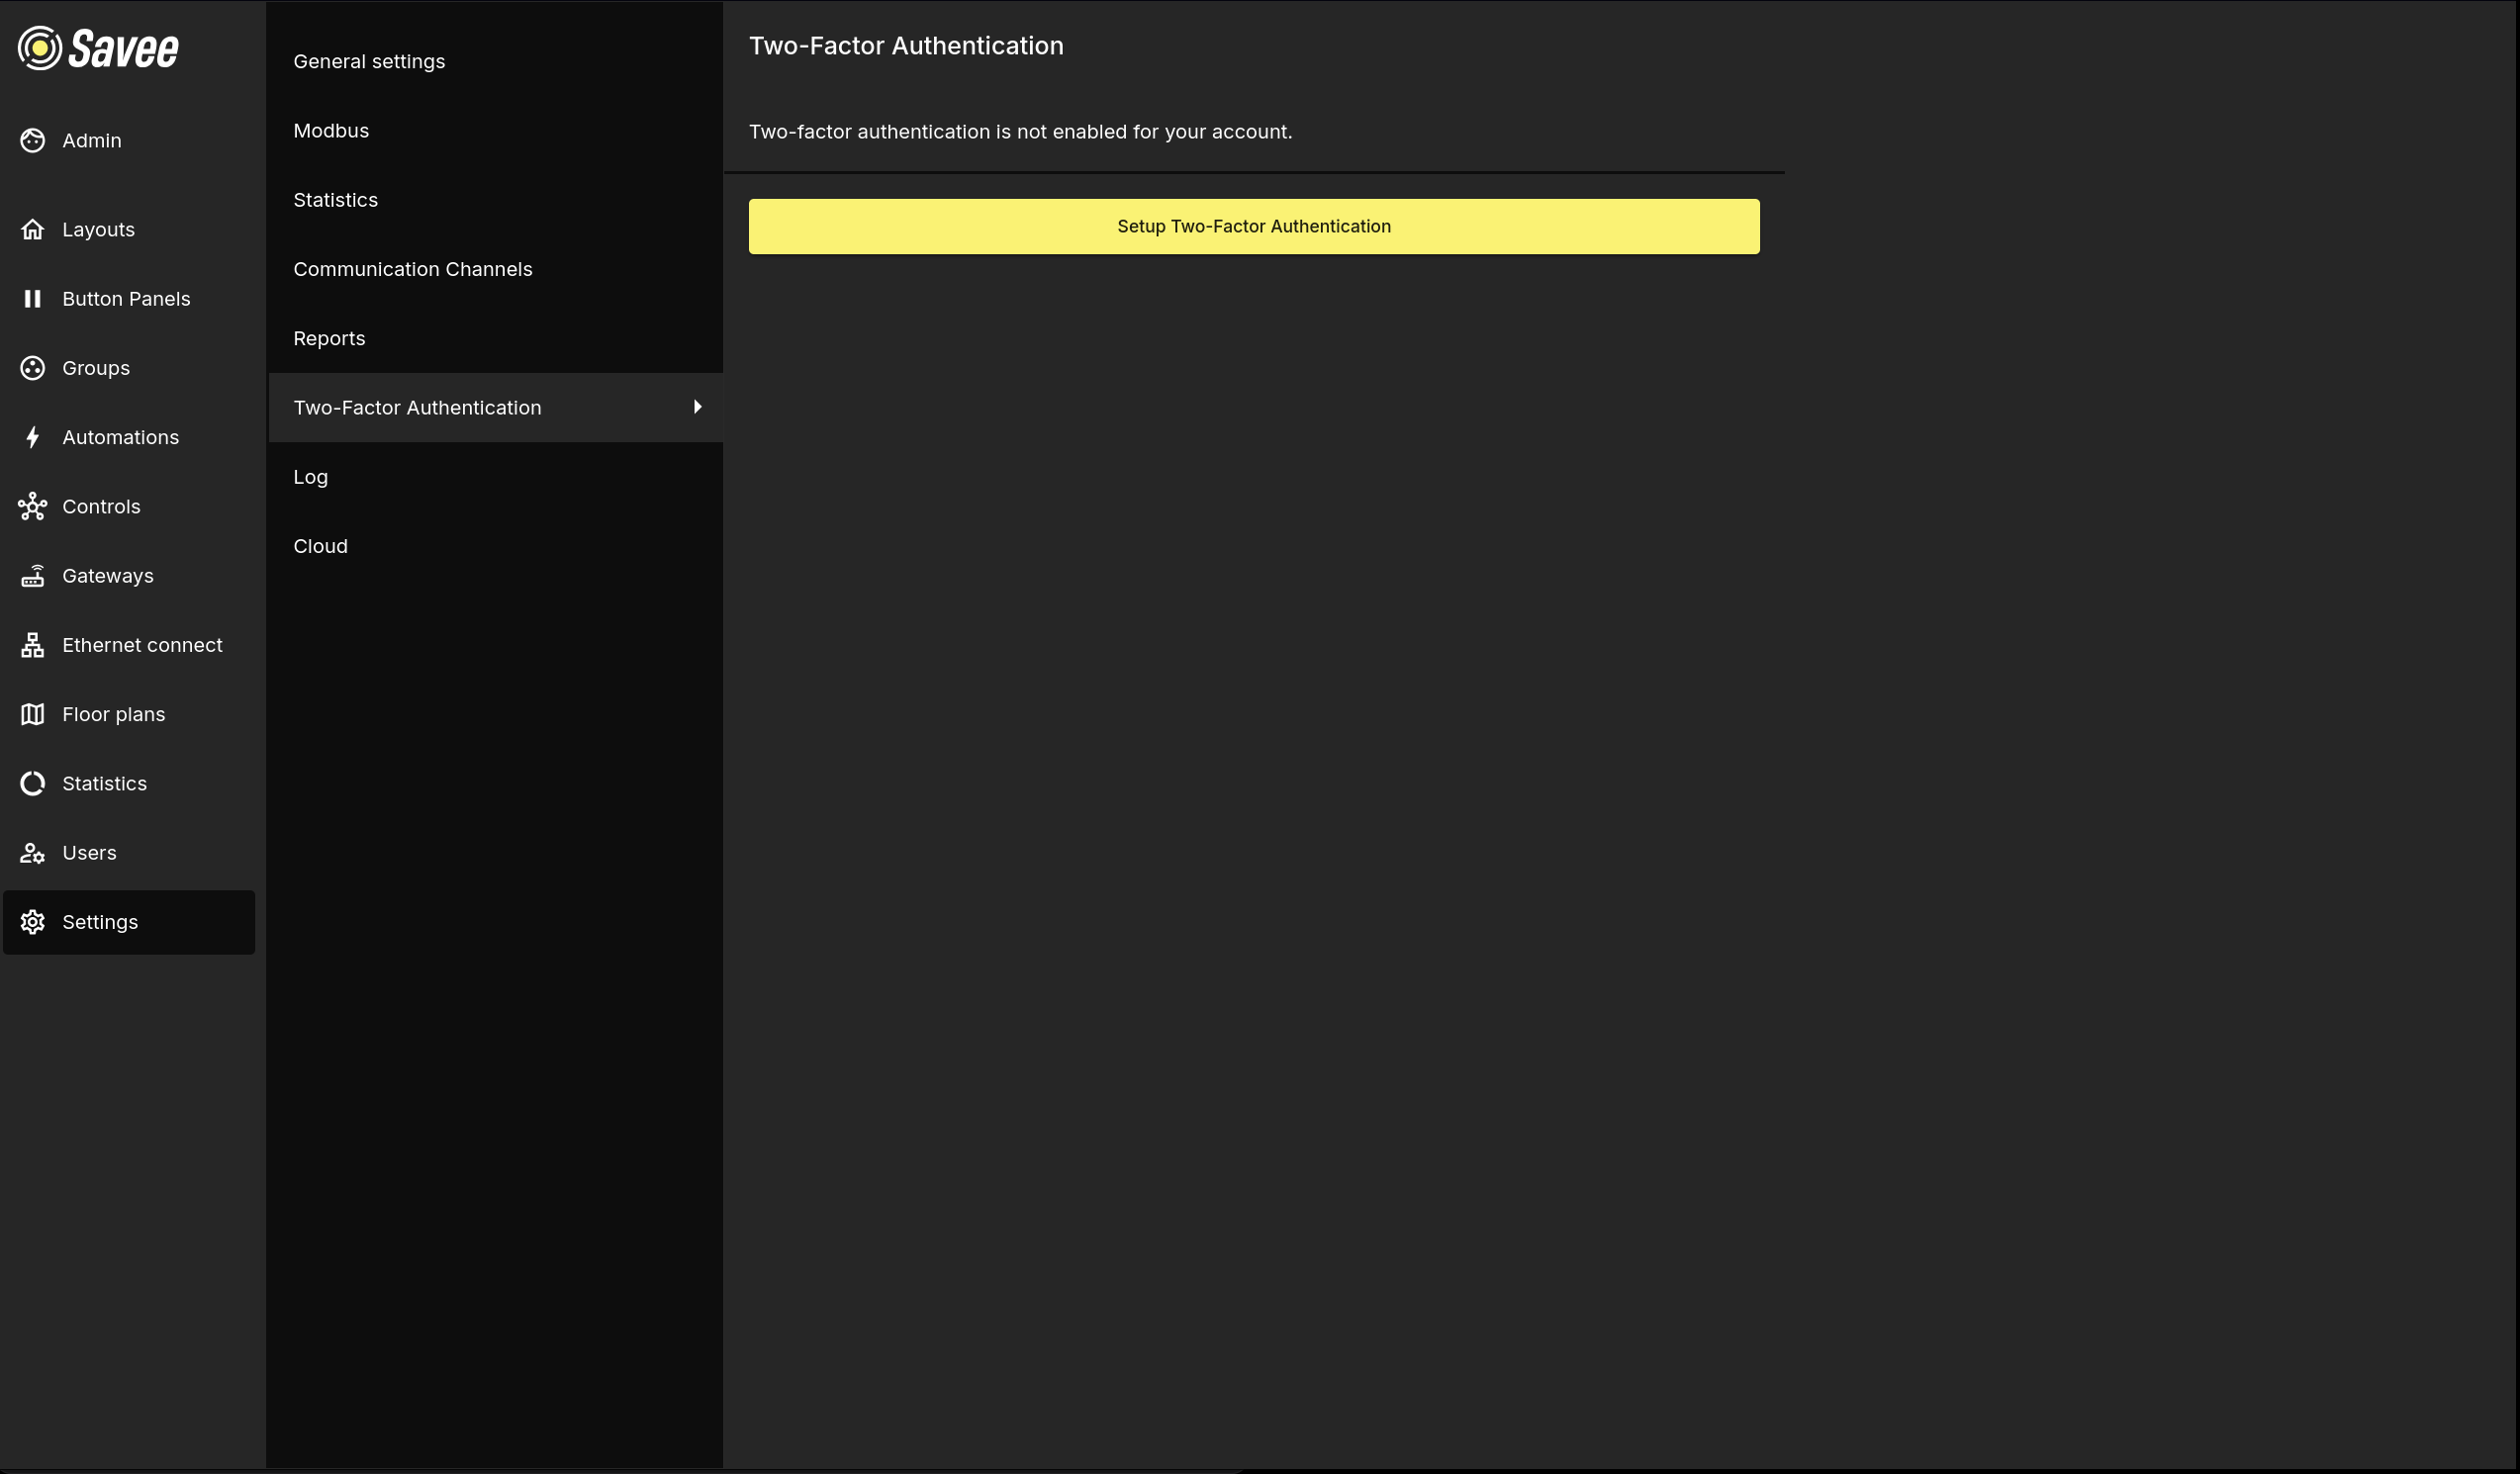
Displays the two-factor authentication status for the currently logged-in account. If 2FA is not yet configured, click Setup Two-Factor Authentication to enable it.
Privacy & Data Protection
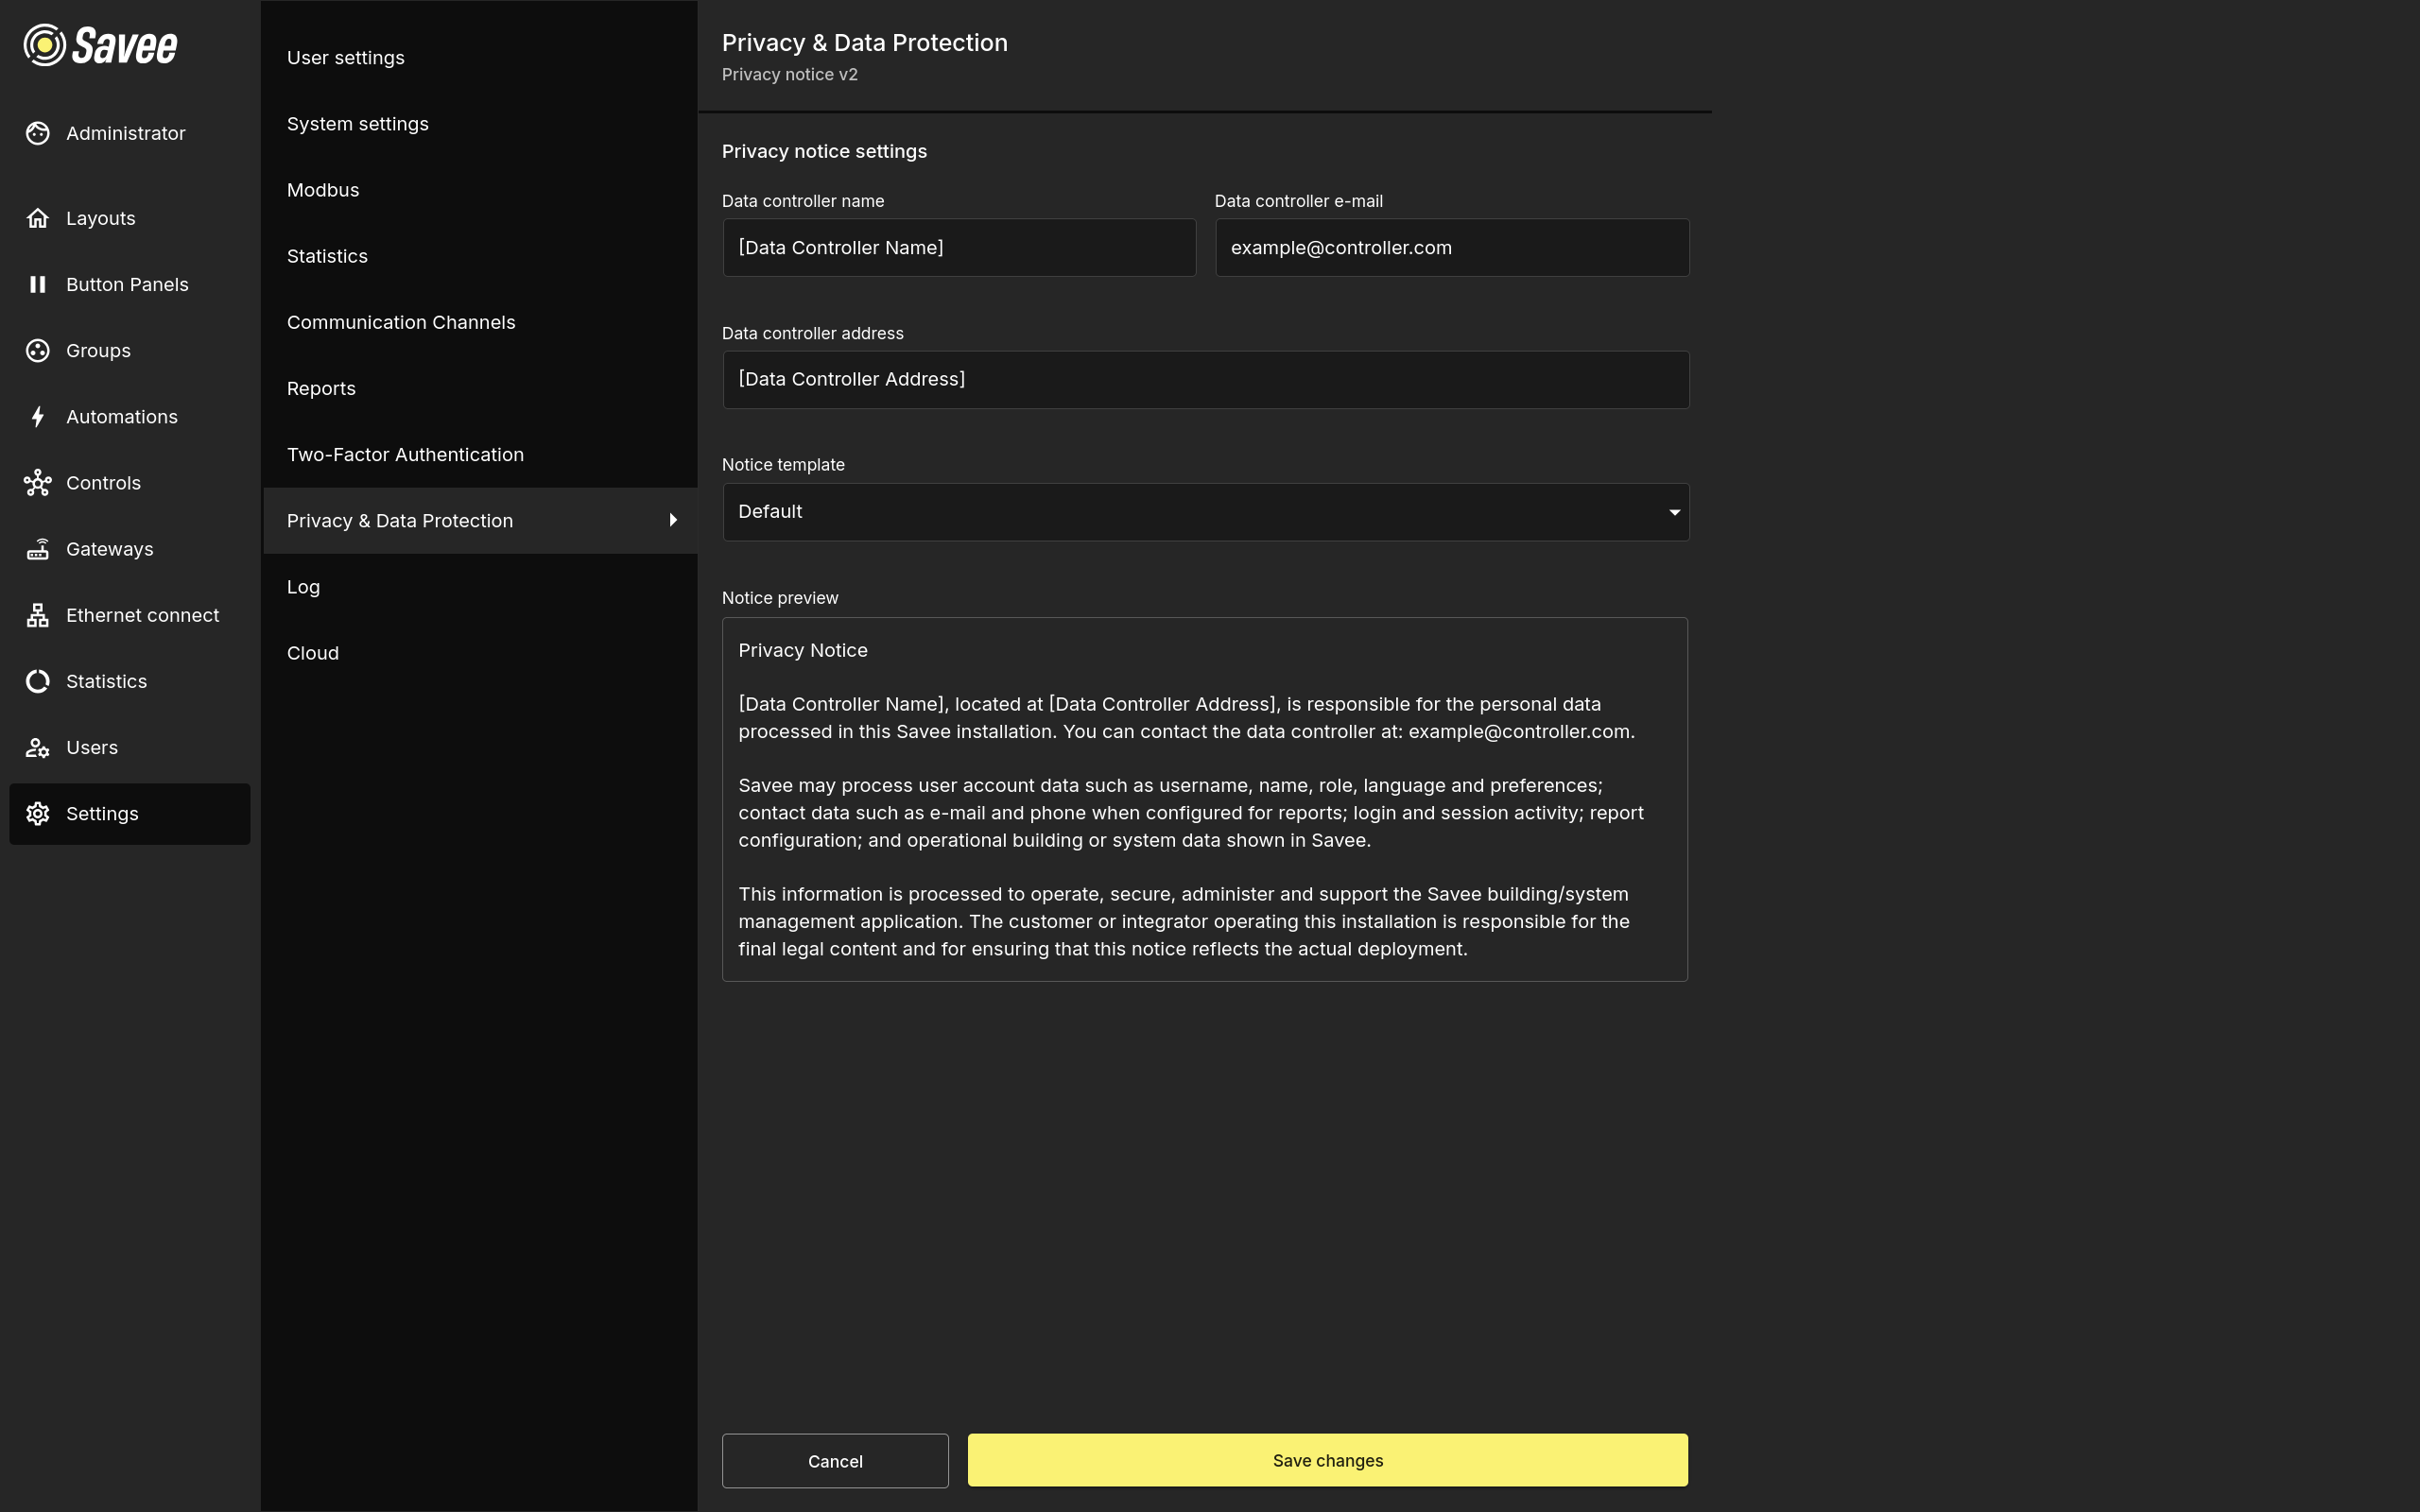
The Privacy & Data Protection section manages the privacy notice shown to users after they sign in. The notice is installation-specific and contains the contact details of the personal data controller.
The superadmin role can edit the notice. Other roles can open this section to read the current notice and revoke their acknowledgement.
| Field | Description |
|---|---|
| Template | Select Default to use the built-in translated template, or Custom to provide the full notice text manually. |
| Controller name | The legal name of the organization or person responsible for personal data processing. |
| Controller e-mail | The contact e-mail address for privacy-related requests. |
| Controller address | The postal address of the controller. |
| Custom text | The full privacy notice text used when the template is set to Custom. |
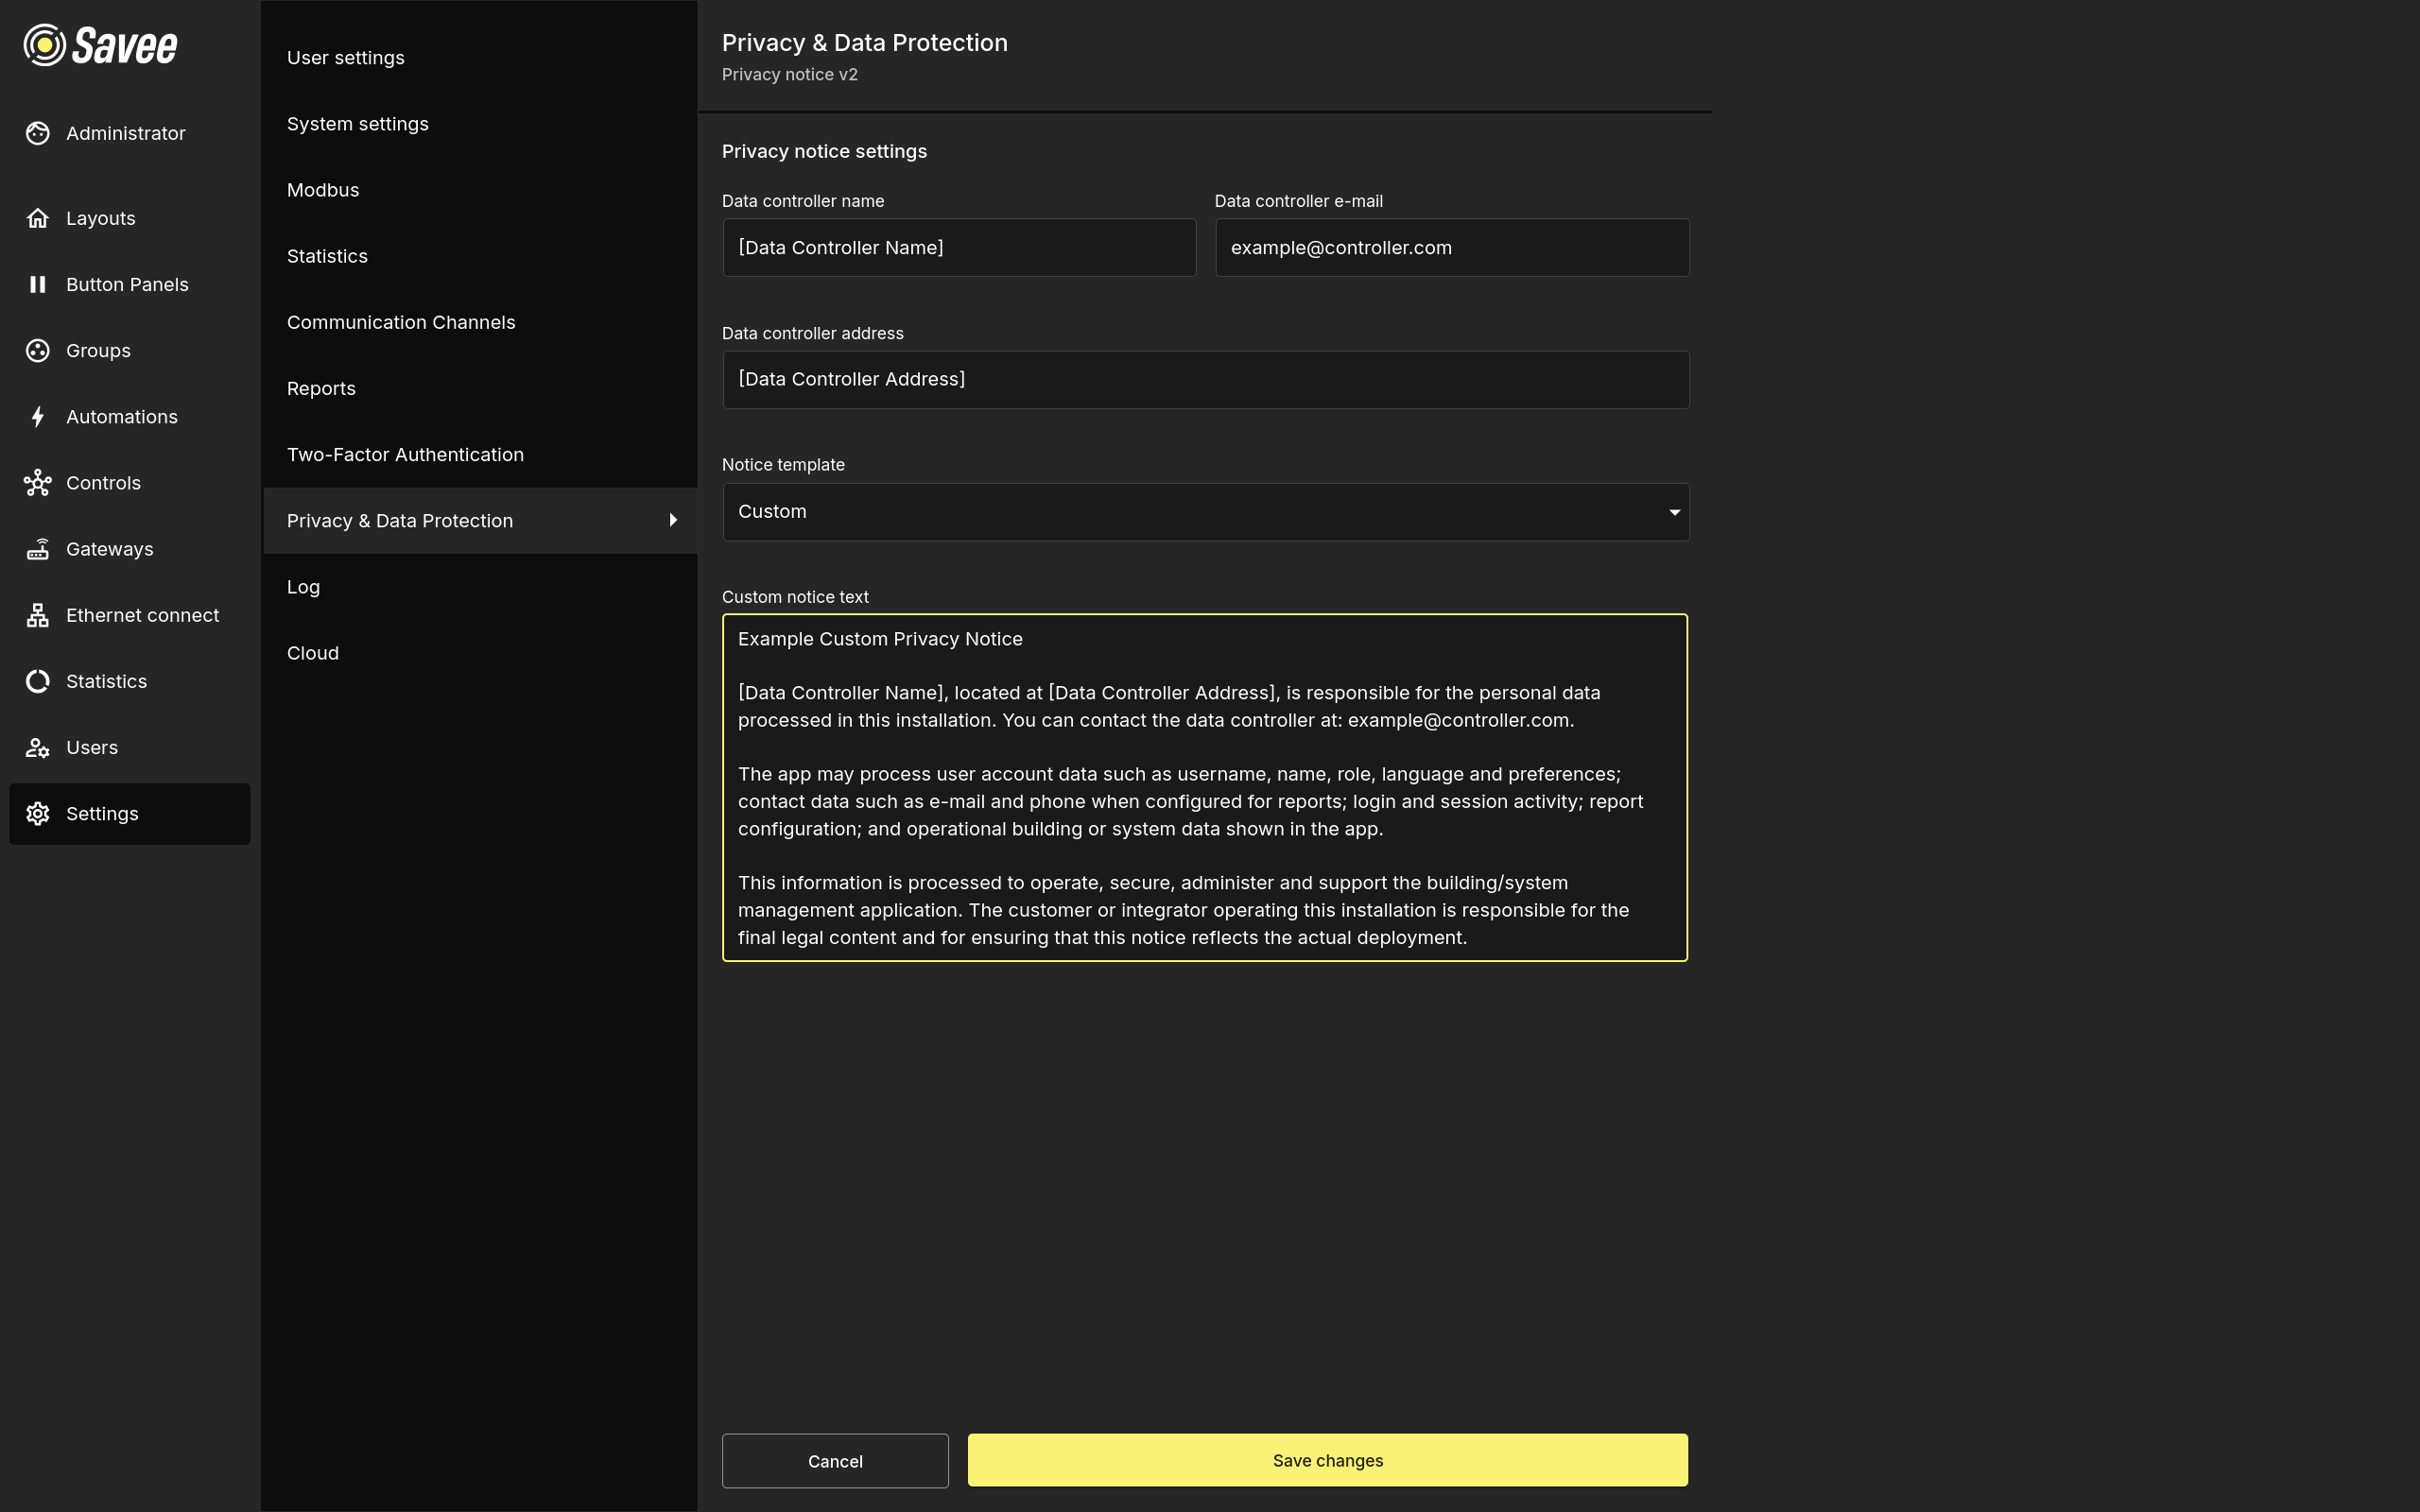
Use the preview to review how the notice will appear to users before saving changes. When the notice text or controller details change, Savee creates a new notice version and users are asked to acknowledge it again on their next sign-in. Acknowledgements and revocations are recorded in the Log.
Warning
The operator of the installation is responsible for the legal content of the privacy notice. Review the default template and replace it with custom text when the installation requires different wording.
Revoke Acknowledgement
Users can revoke their acknowledgement from the Privacy & Data Protection section. After clicking Revoke acknowledgement, the user is signed out. On the next sign-in, Savee shows the current notice again and requires a new acknowledgement before the user can continue.
Log
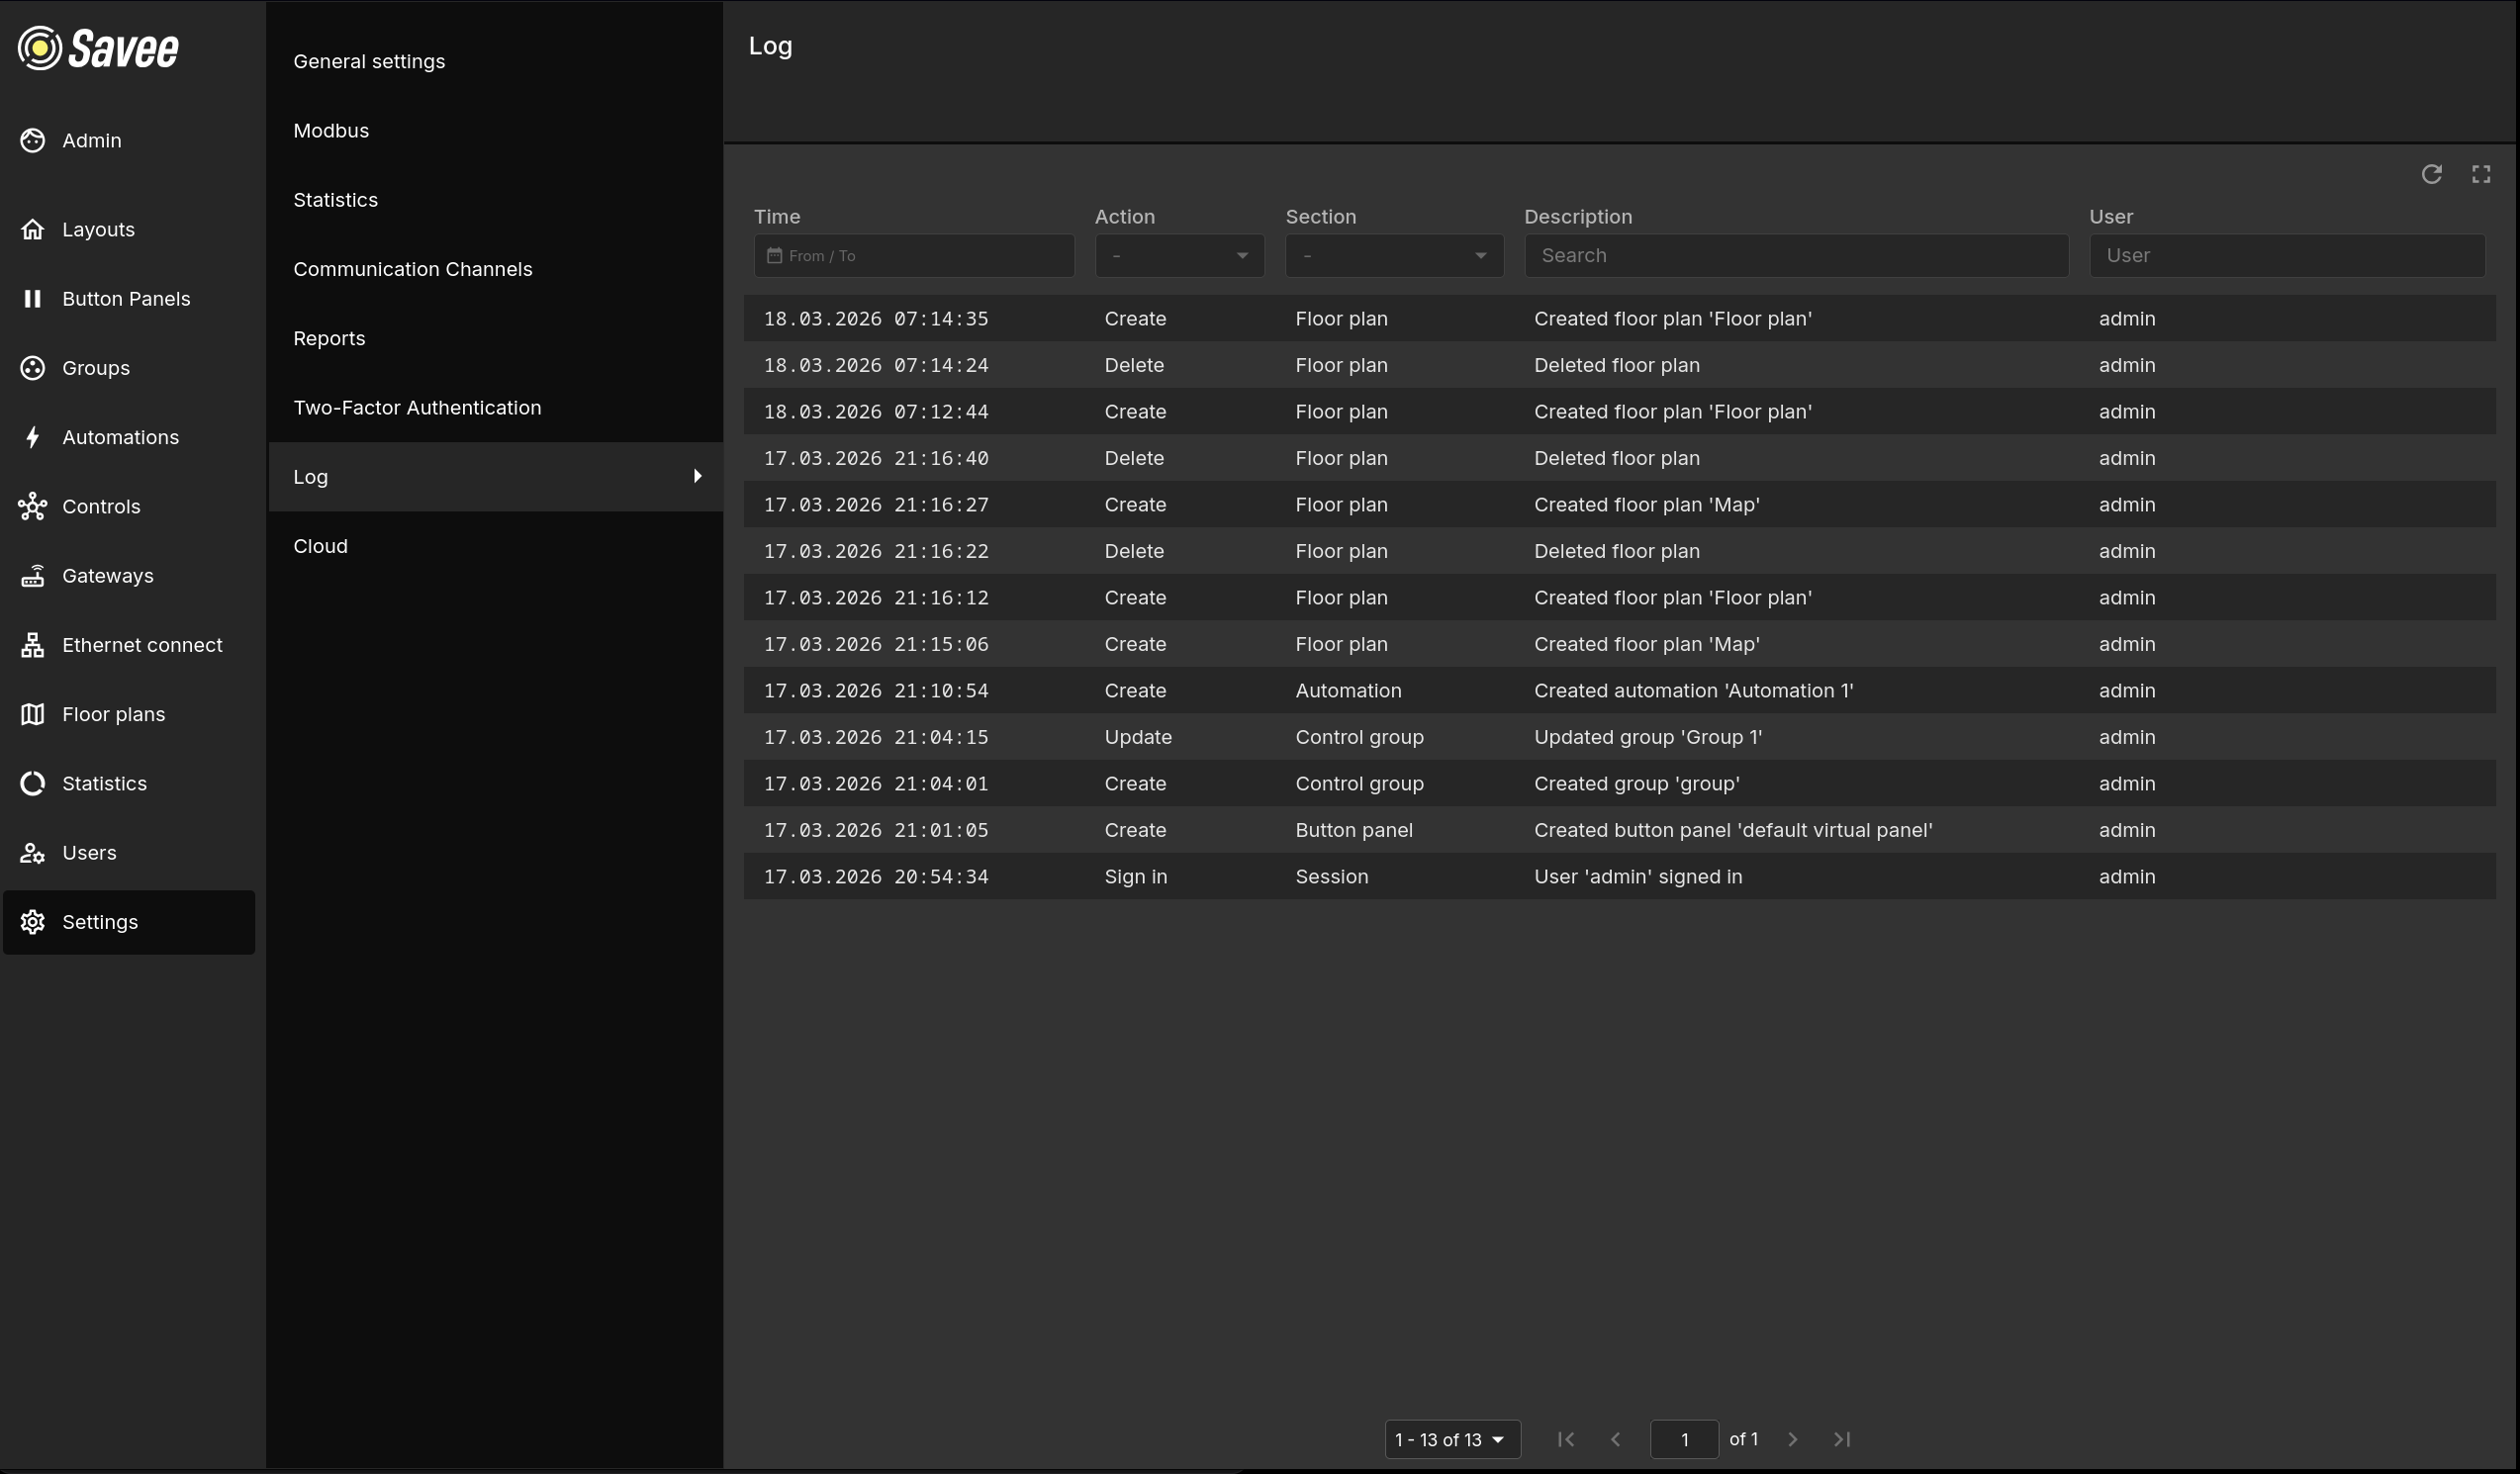
The Log records all significant actions performed in the application, providing a full audit trail. Each entry includes:
| Column | Description |
|---|---|
| Time | The timestamp of the action. Filter by date range using the From / To input. |
| Action | The type of operation (e.g. Create, Update, Delete, Sign in). Filter using the dropdown. |
| Section | The part of the application where the action occurred (e.g. Floor plan, Automation, Control group). Filter using the dropdown. |
| Description | A human-readable description of what was done. Searchable by keyword. |
| User | The user account that performed the action. Filterable by username. |
Use the refresh button to reload the log and the fullscreen button to expand the view. The log is paginated.